Overview
The Tag Insight dashboard is your command center for tracking quality management. It provides at-a-glance insights into your tracking health, recent issues, and ongoing audits across all your projects.Dashboard layout
Based on the Tag Insight menu structure, your dashboard includes: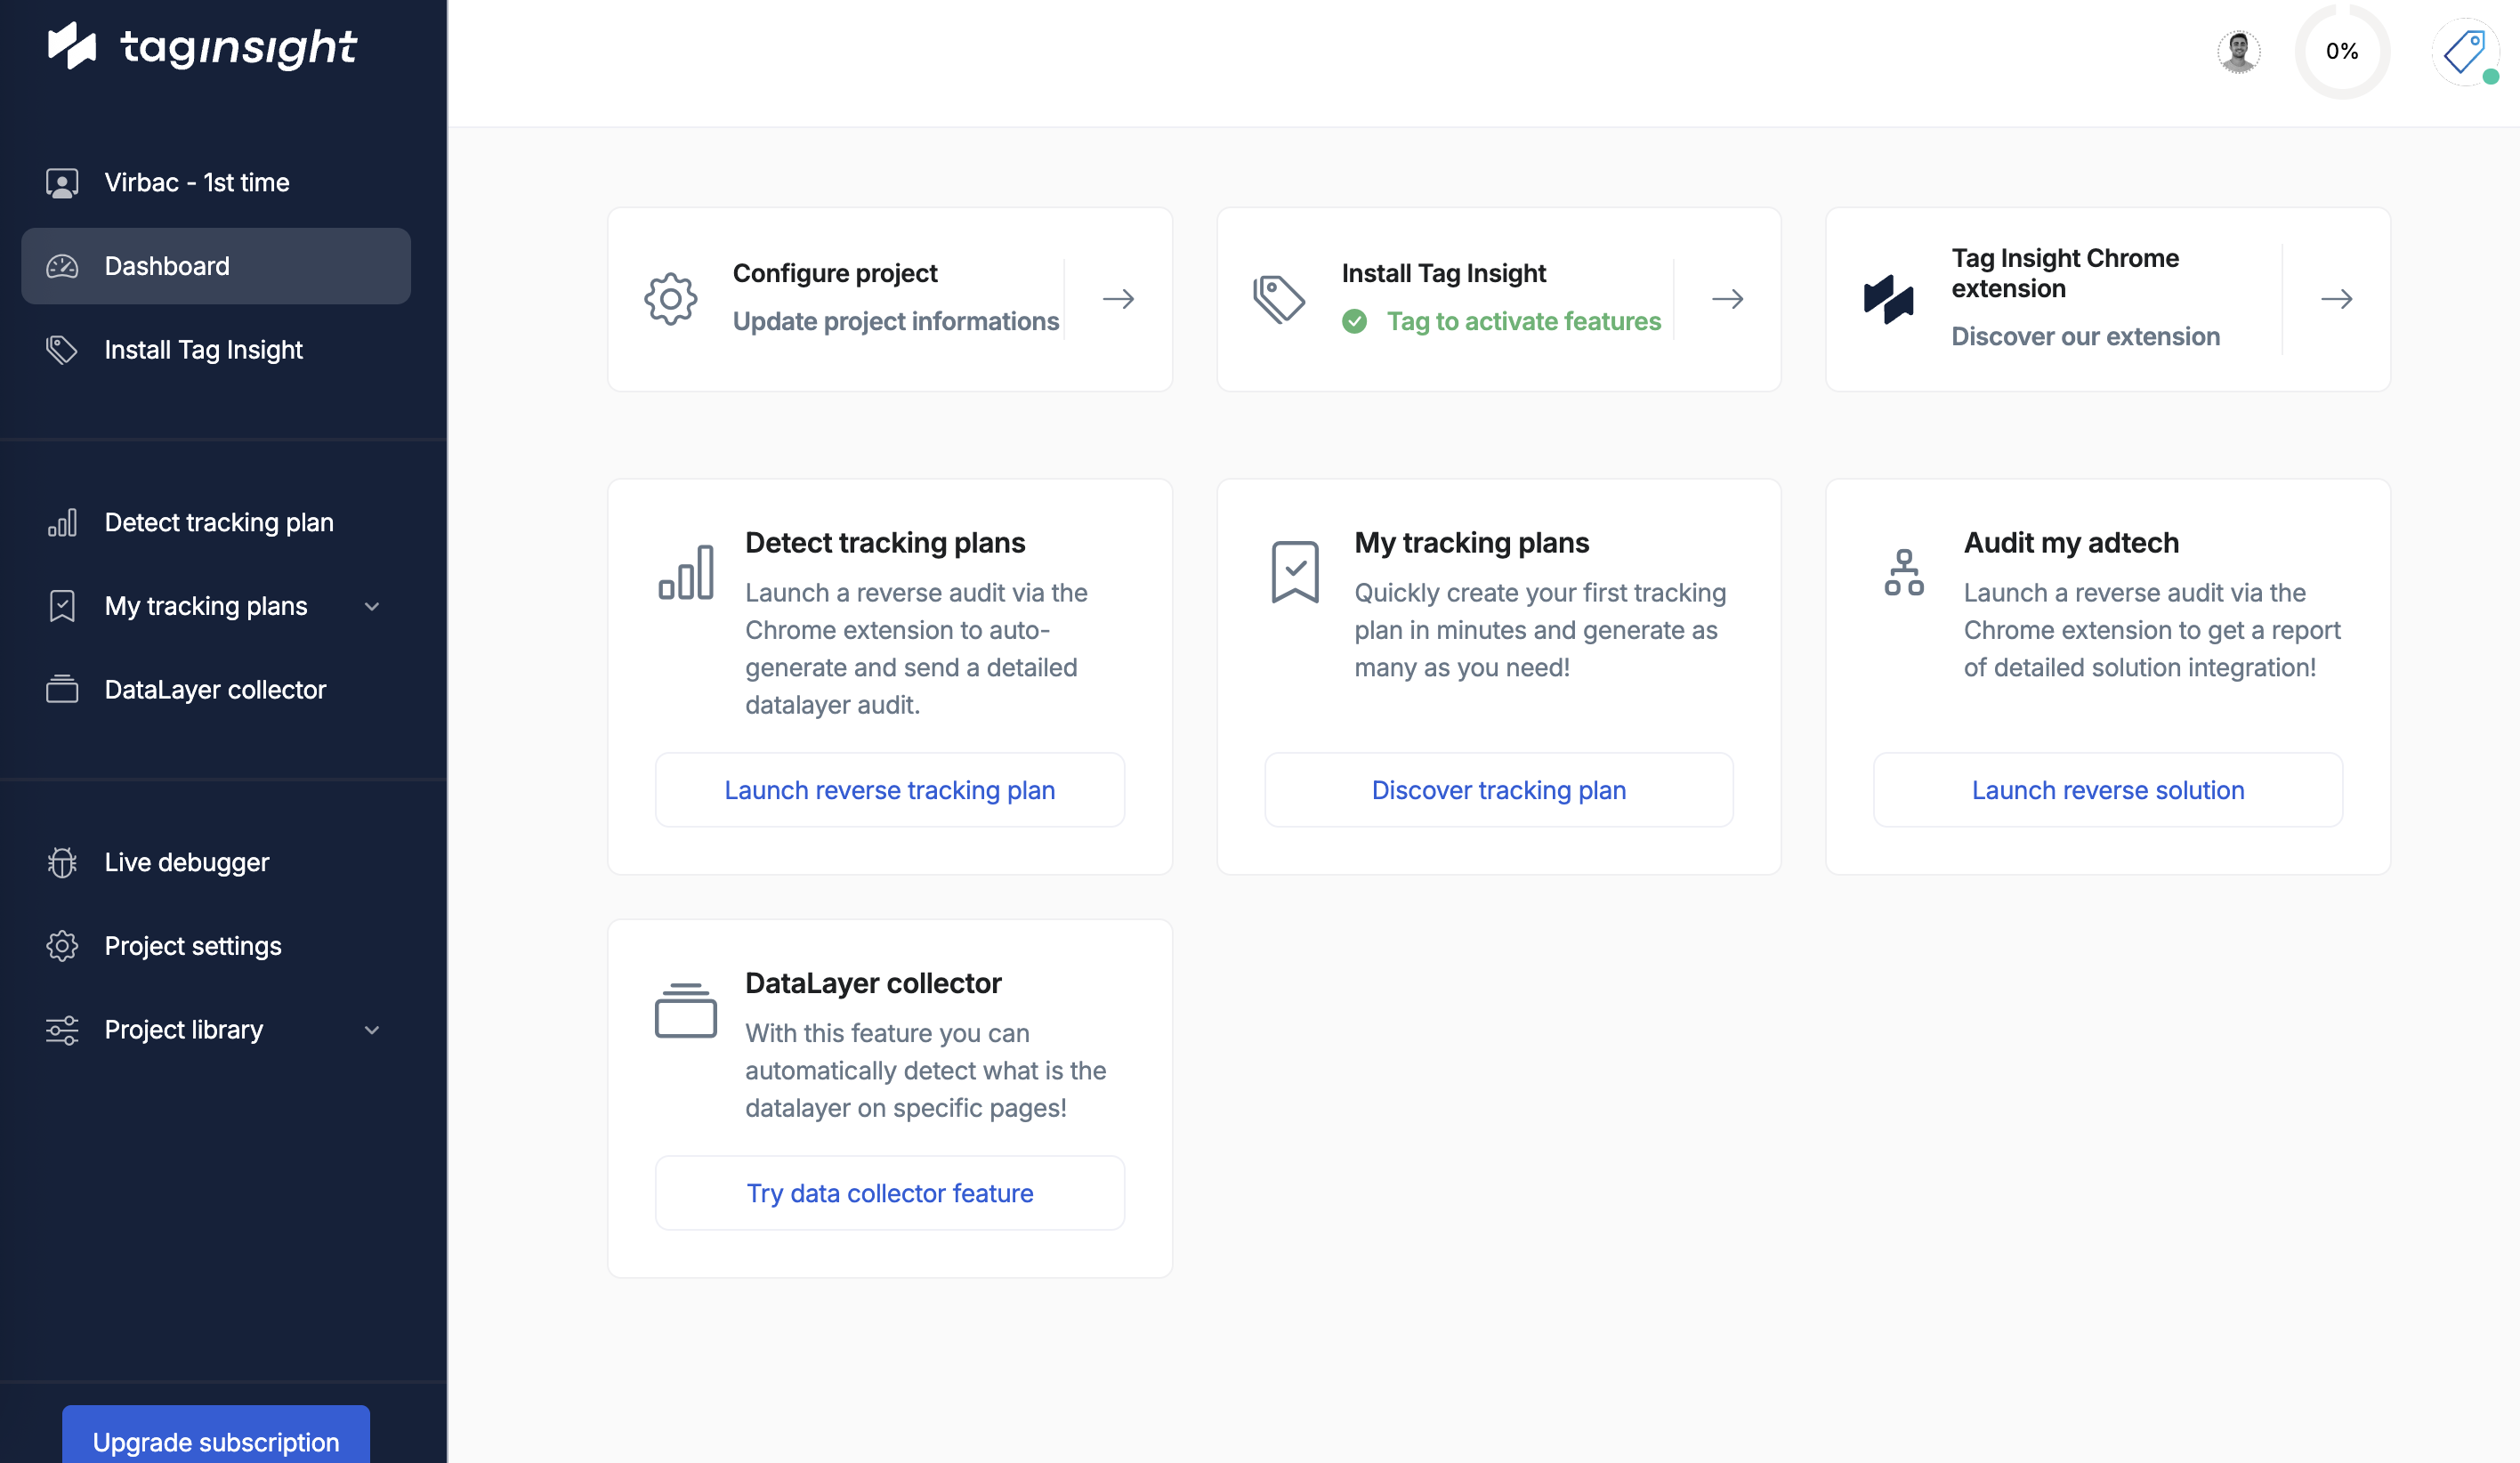
Main navigation
- Project level
- Project library
- Dashboard: Overview and metrics
- Install Tag Insight: Pixel installation guide
- Detect tracking plan: Automatic discovery
- My tracking plans: Plan management
- Audit my adtech: Monitoring configuration
- DataLayer collector: Historical data logging
- Live debugger: Real-time debugging
- Project settings: Configuration options
Dashboard components
Tracking health score
The main metric showing overall tracking quality:- Based on successful validations vs total events
- Weighted by event importance
- Updated in real-time or after each audit
Recent issues panel
Quick view of the latest tracking problems:Recent issues
Critical (2)
- Missing “purchase” event on /checkout/confirm - 2 hours ago
- Transaction ID format invalid - 3 hours ago
- Optional “coupon” field missing - 4 hours ago
- Price format inconsistency - 6 hours ago
- New untracked event detected - 1 day ago
Audit status
Monitor your active audits:Traffic overview
Real-time tracking activity:Events/hour
15.2K
↑ 12% from average
Active users
3,421
Currently on site
Error rate
0.8%
↓ Improving
Key metrics
Tracking coverage
Visual representation of tracking completeness:Trend analysis
Historical tracking quality:Top issues
Most frequent tracking problems:Quick actions
Access frequently used features:Run audit now
Trigger an immediate audit of your tracking
View latest report
Access the most recent audit report
Debug live
Open the live debugger
Export data
Download tracking quality reports
Project selector
Switch between projects easily:Notifications center
Stay informed about tracking health:- Alerts
- Updates
- Team activity
- 🔴 Critical: Purchase tracking failed (2h ago)
- 🟡 Warning: High error rate detected (5h ago)
- 🔵 Info: New tracking plan version available
Customization options
Dashboard widgets
Customize your dashboard view:- Click Customize Dashboard
- Add/remove widgets:
- Tracking Health Score
- Recent Issues
- Traffic Metrics
- Custom Reports
- Team Activity
- Drag to rearrange
- Save layout
Saved views
Create custom dashboard configurations:- Executive View: High-level metrics only
- Developer View: Technical details and errors
- QA View: Focus on validation and testing
- Custom Views: Create your own
Integration points
External dashboards
Embed Tag Insight metrics:Export options
Export dashboard data in multiple formats:- PDF reports for stakeholders
- CSV data for analysis
- Markdown for documentation
Performance indicators
System status
Monitor Tag Insight service health:- Pixel Status: ✅ Operational
- Data Processing: ✅ Real-time
- Audit Engine: ✅ Running
- Export: ✅ Available
Resource usage
For enterprise accounts:- Events Processed: 1.2M / 5M limit
- Storage Used: 34GB / 100GB
- Audit Hours: 168 / 500
- Audit Runs: 12,451 / 50,000
Best practices
Daily routine
1
Morning check
Review overnight issues and tracking health
2
Issue triage
Prioritize critical issues for immediate action
3
Monitor trends
Check if error rates are increasing
4
End of day review
Ensure no new critical issues before close
Dashboard hygiene
- Clear resolved issues to maintain clarity
- Update saved views as needs change
- Archive old projects to reduce clutter
- Review widget relevance monthly
Mobile access
The Tag Insight dashboard is responsive:- Full functionality on tablets
- Read-only view optimized for phones
- Push notifications for critical alerts
- Offline mode for cached data
Keyboard navigation
Navigate efficiently with shortcuts:FAQ
How often does the dashboard update?
How often does the dashboard update?
Real-time metrics update every 30 seconds. Audit results update upon completion.
Is there a dark mode?
Is there a dark mode?
Yes, toggle in user preferences or use system setting detection.
Can I export dashboard data?
Can I export dashboard data?
Yes, export as PDF reports or CSV data.
Next steps
Install pixel
Set up Tag Insight monitoring
Configure audits
Create your monitoring strategy
Team setup
Add team members
Live debugging
Start real-time debugging