> ## Documentation Index
> Fetch the complete documentation index at: https://docs.taginsight.com/llms.txt
> Use this file to discover all available pages before exploring further.
# Live debugger
> Real-time tracking debugging and data layer inspection
## Overview
The Live Debugger is a powerful web-based tool within Tag Insight that allows you to monitor and debug tracking implementations in real-time. Unlike the Chrome extension, the Live Debugger runs directly in your Tag Insight dashboard, providing comprehensive insights into your tracking data flow.
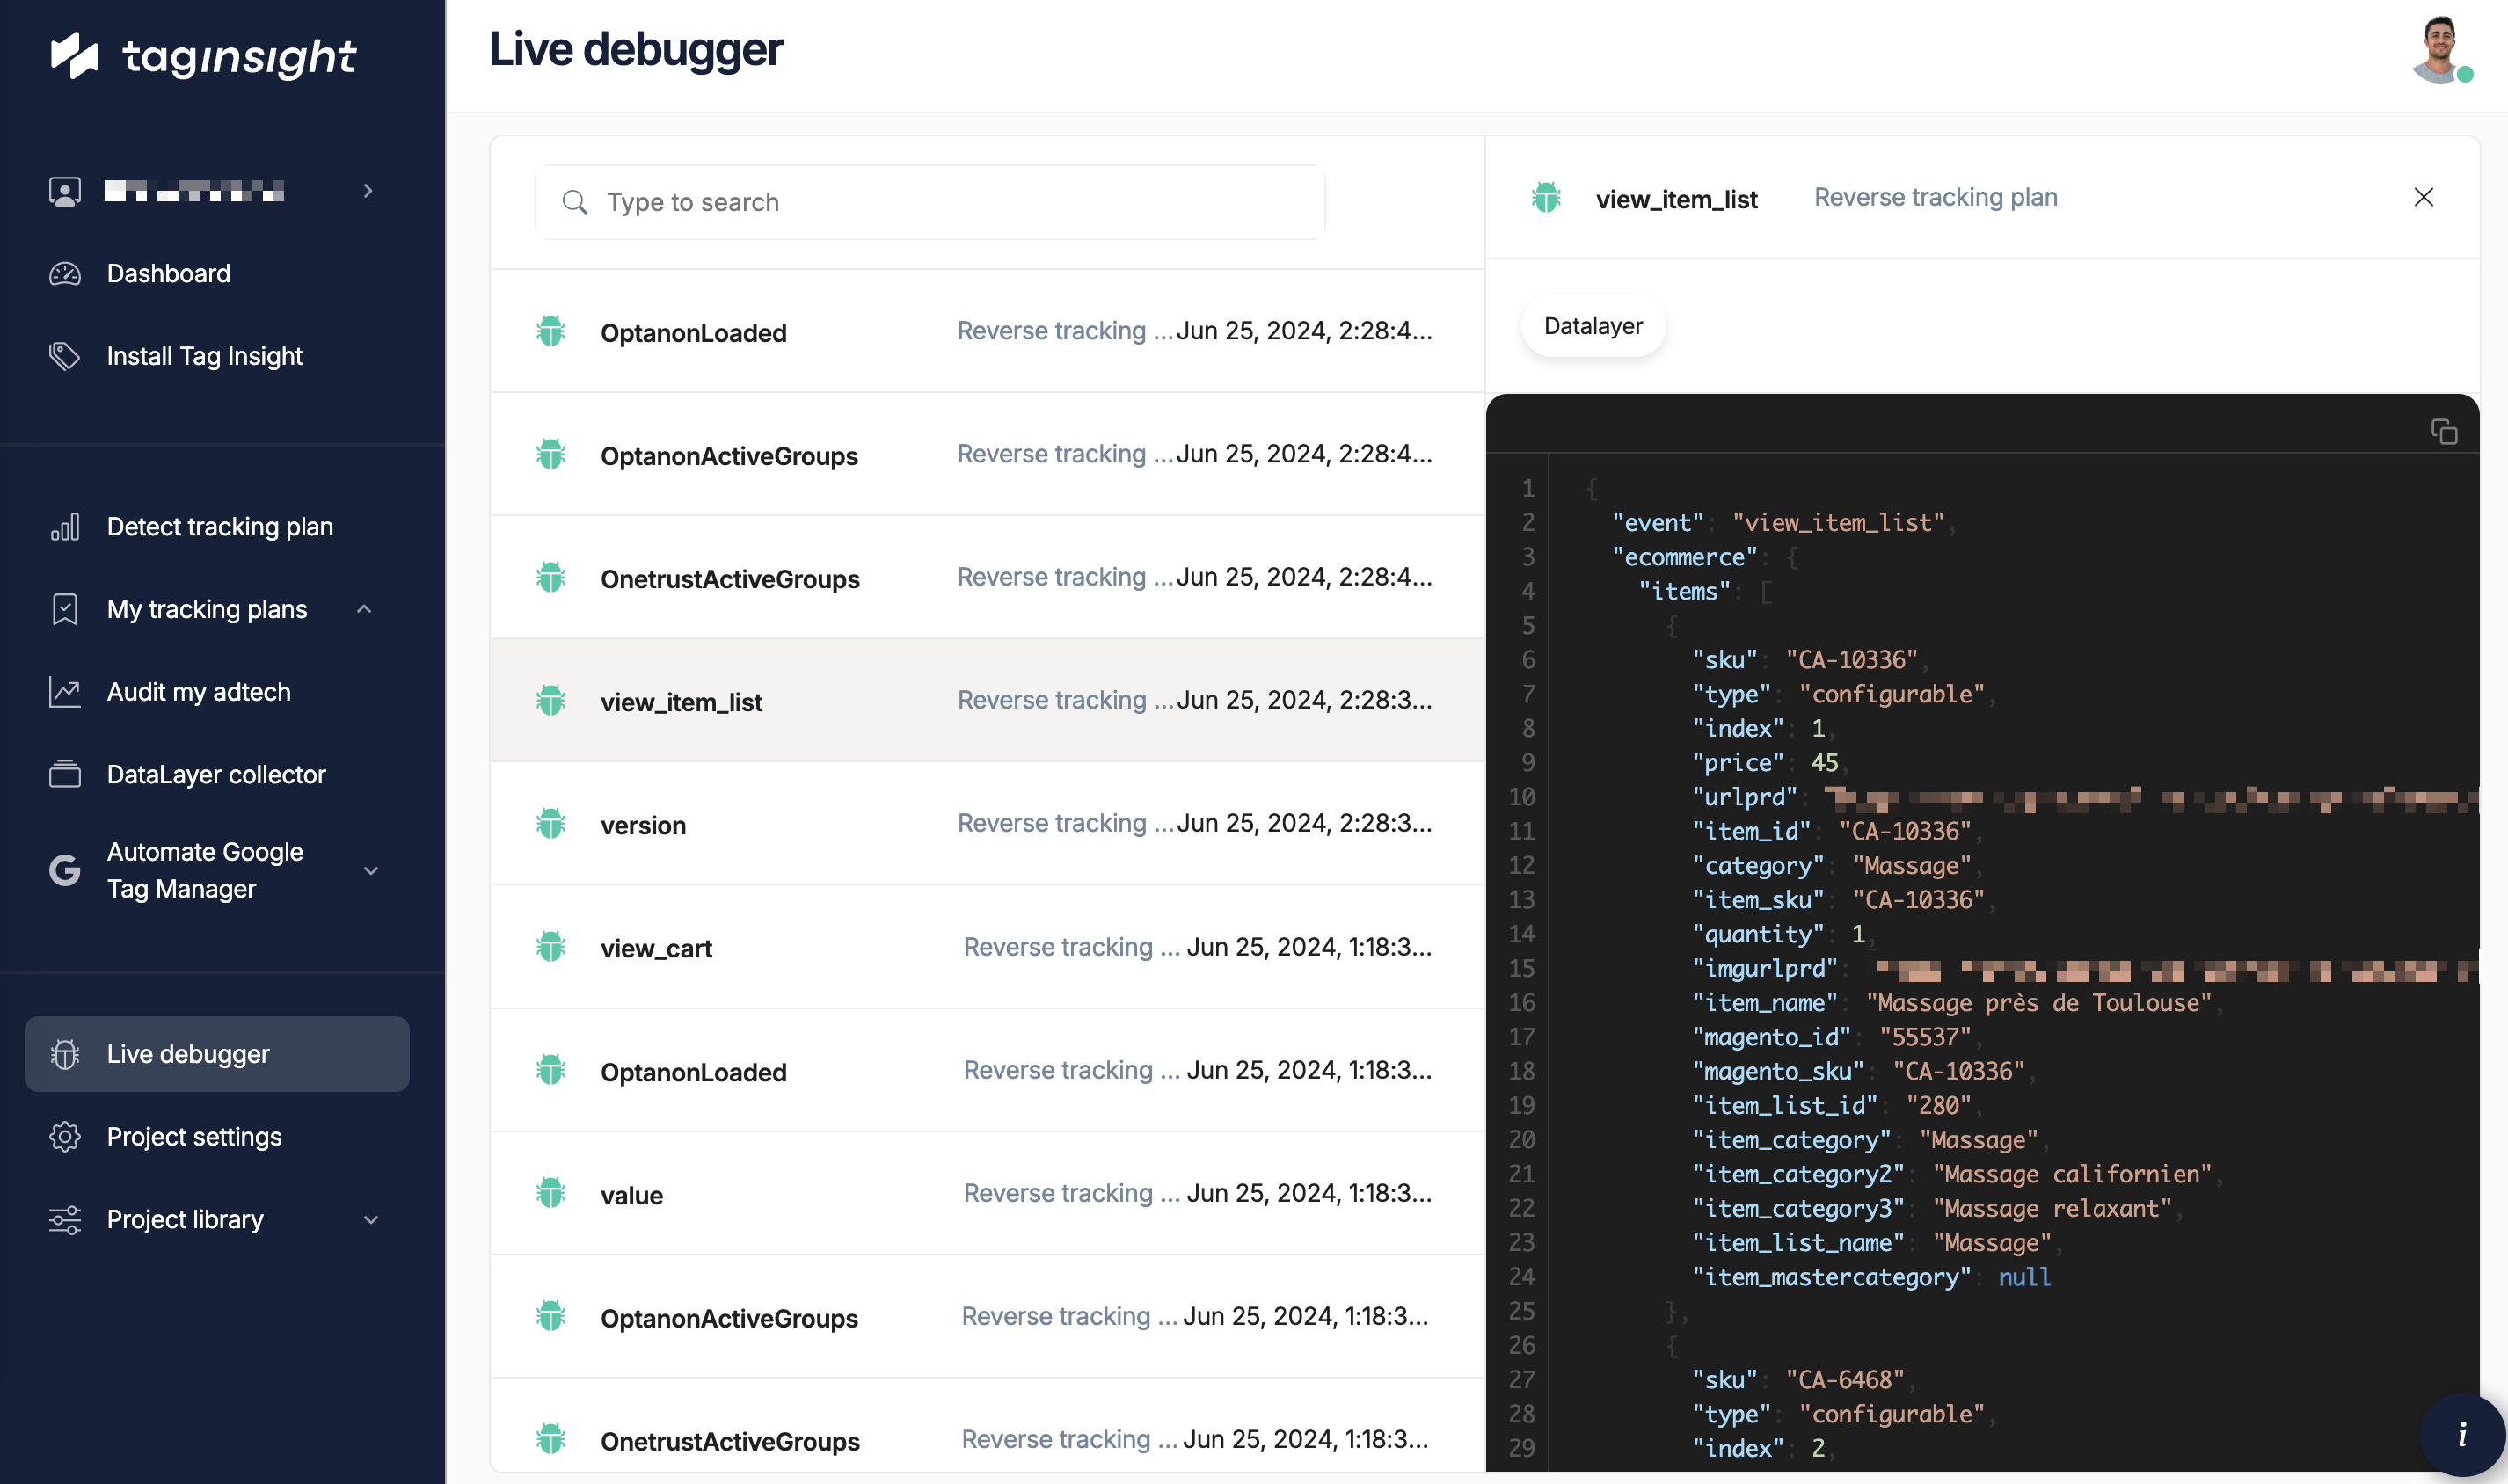 Based on the Tag Insight menu structure, the Live Debugger is accessible directly from your project dashboard alongside other monitoring tools.
## Accessing the Live Debugger
Log into Tag Insight and select your project
Find "Live debugger" in the project menu
The debugger automatically connects to your site's tracking
## Key features
Watch events fire as users interact with your site
Examine complete data layer contents
See immediate validation against your tracking plan
Find specific events or issues quickly
## Interface Overview
### Event stream Panel
The main panel shows all tracking events in real-time:
```
┌─────────────────────────────────────────────────────────────────┐
│ Live Debugger - Project: Main Site Production │
├─────────────────────────────────────────────────────────────────┤
│ 🔴 Recording | Events: 247 | Errors: 3 | Warnings: 12 │
├─────────────────────────────────────────────────────────────────┤
│ 10:32:15 | ✅ page_view | /products/shoes | Valid │
│ 10:32:16 | ✅ product_view | SKU-12345 | Valid │
│ 10:32:18 | ⚠️ add_to_cart | SKU-12345 | Warning │
│ 10:32:20 | ❌ checkout_start | /checkout | Error │
└─────────────────────────────────────────────────────────────────┘
```
### Event details Panel
Click any event to see detailed information:
```javascript theme={null}
{
event: "add_to_cart",
ecommerce: {
currency: "EUR",
value: 89.99,
items: [{
item_id: "SKU-12345",
item_name: "Running Shoes",
price: 89.99,
quantity: 1,
item_category: "Footwear"
}]
},
user_data: {
logged_in: true,
customer_type: "returning"
}
}
```
```
✅ Event name: Valid
✅ Currency: Valid (EUR)
⚠️ Value: Warning - Should include tax
✅ Items array: Valid
✅ Item structure: Valid
⚠️ Missing: shipping_tier (optional)
```
```
Timestamp: 2024-01-15T10:32:18.123Z
Page URL: https://example.com/products/shoes
User Agent: Chrome 120.0.0.0
Session ID: sess_abc123
IP: 192.168.1.1 (anonymized)
Tag Insight Pixel: v1.2.3
```
## Debugging Features
### Live Validation
The debugger validates events against your tracking plan in real-time:
* **Green checkmark (✅)**: Event passes all validation rules
* **Yellow warning (⚠️)**: Minor issues or missing optional data
* **Red error (❌)**: Critical validation failures
### Filter Options
Focus on specific issues:
* Filter by specific events (e.g., only "purchase" events)
* Show only e-commerce events
* Hide page\_view events for clarity
* Show only errors
* Show only warnings
* Show successful events
* Show unknown events
* Filter by URL pattern
* Focus on specific sections
* Exclude admin pages
* Last 5 minutes
* Last hour
* Custom time range
### Search Functionality
Powerful search across all event data:
```
Search examples:
- "transaction_id:ORD-12345" - Find specific order
- "value:>100" - Find high-value events
- "error:missing_variable" - Find specific errors
- "user_id:null" - Find events with null user IDs
```
## Advanced Features
### Session Replay
Link events to specific user sessions:
Toggle from "All Events" to "Session View"
Select a specific session ID or user
See complete event sequence for that session
Spot where tracking breaks in user journey
### Compare Mode
Compare expected vs actual data:
```
Expected (from Tracking Plan) | Actual (from Live Data)
----------------------------------|----------------------------------
event: "purchase" | event: "purchase" ✅
transaction_id: string (required) | transaction_id: "ORD-789" ✅
value: number (required) | value: "99.99" ❌ (string)
currency: string (required) | currency: "EUR" ✅
items: array (required) | items: [...] ✅
coupon: string (optional) | [missing] ⚠️
```
### Export Capabilities
Export debugging sessions for analysis:
* **JSON Export**: Complete event data
* **CSV Export**: Simplified tabular format
* **Share Link**: Send session to teammates
* **Create Report**: Generate debugging report
## Use Cases
### During Development
Verify tracking for new features before release
Ensure third-party tools integrate correctly
### Production Monitoring
Debug reported tracking problems
Monitor tracking performance metrics
## Integration with Other Tools
### Chrome extension
The Live Debugger complements the Chrome extension:
* **Chrome Extension**: Local debugging, single user
* **Live Debugger**: All traffic, multiple users
* **Both**: Can be used simultaneously
### Audit Reports
Link from audit reports to live debugging:
1. Find issue in audit report
2. Click "Debug Live"
3. Opens Live Debugger filtered to that issue
4. See real-time occurrences
### Data layer Collector
Switch between tools seamlessly:
* **Live Debugger**: Real-time monitoring
* **Data Layer Collector**: Historical analysis
* **Use both**: Complete picture of tracking health
## Best practices
### Effective Debugging
Begin with all events to understand context
Apply filters to focus on specific issues
Look for commonalities in failures
Make changes and verify in real-time
### Performance Tips
For high-traffic sites:
* **Use Sampling**: Enable sampling mode for performance
* **Apply Filters Early**: Reduce data volume
* **Focus Sessions**: Debug specific users/sessions
* **Clear Old Data**: Regularly clear debugging cache
## Common Debugging Scenarios
### Scenario 1: Missing Purchase Events
```
Filter: event:"purchase" OR page:"/confirmation"
Finding: Page loads without purchase events
Solution: Check conditional logic in tracking code
```
### Scenario 2: Malformed Data
```
Filter: status:"error" AND validation:"type_mismatch"
Finding: Prices sent as strings
Solution: Fix data type conversion
```
### Scenario 3: Timing Issues
```
View: Session replay mode
Finding: Events fire before data is ready
Solution: Implement proper event sequencing
```
## Keyboard Shortcuts
Speed up debugging with shortcuts:
| Shortcut | Action |
| -------- | ------------------- |
| `Space` | Pause/Resume stream |
| `C` | Clear event list |
| `F` | Focus filter box |
| `E` | Export current view |
| `S` | Toggle session mode |
| `Esc` | Close detail panel |
## Troubleshooting
* Verify pixel is installed and active
* Check browser ad blockers
* Confirm project selection
* Try refreshing the debugger
* Check network connection
* Enable sampling mode
* Clear debugging cache
* Contact support if persistent
* Ensure tracking plan is configured
* Check event names match exactly
* Verify validation rules are set
* Refresh tracking plan cache
## Next steps
Use for local debugging
Analyze historical data
Advanced debugging techniques
Configure automated monitoring
Based on the Tag Insight menu structure, the Live Debugger is accessible directly from your project dashboard alongside other monitoring tools.
## Accessing the Live Debugger
Log into Tag Insight and select your project
Find "Live debugger" in the project menu
The debugger automatically connects to your site's tracking
## Key features
Watch events fire as users interact with your site
Examine complete data layer contents
See immediate validation against your tracking plan
Find specific events or issues quickly
## Interface Overview
### Event stream Panel
The main panel shows all tracking events in real-time:
```
┌─────────────────────────────────────────────────────────────────┐
│ Live Debugger - Project: Main Site Production │
├─────────────────────────────────────────────────────────────────┤
│ 🔴 Recording | Events: 247 | Errors: 3 | Warnings: 12 │
├─────────────────────────────────────────────────────────────────┤
│ 10:32:15 | ✅ page_view | /products/shoes | Valid │
│ 10:32:16 | ✅ product_view | SKU-12345 | Valid │
│ 10:32:18 | ⚠️ add_to_cart | SKU-12345 | Warning │
│ 10:32:20 | ❌ checkout_start | /checkout | Error │
└─────────────────────────────────────────────────────────────────┘
```
### Event details Panel
Click any event to see detailed information:
```javascript theme={null}
{
event: "add_to_cart",
ecommerce: {
currency: "EUR",
value: 89.99,
items: [{
item_id: "SKU-12345",
item_name: "Running Shoes",
price: 89.99,
quantity: 1,
item_category: "Footwear"
}]
},
user_data: {
logged_in: true,
customer_type: "returning"
}
}
```
```
✅ Event name: Valid
✅ Currency: Valid (EUR)
⚠️ Value: Warning - Should include tax
✅ Items array: Valid
✅ Item structure: Valid
⚠️ Missing: shipping_tier (optional)
```
```
Timestamp: 2024-01-15T10:32:18.123Z
Page URL: https://example.com/products/shoes
User Agent: Chrome 120.0.0.0
Session ID: sess_abc123
IP: 192.168.1.1 (anonymized)
Tag Insight Pixel: v1.2.3
```
## Debugging Features
### Live Validation
The debugger validates events against your tracking plan in real-time:
* **Green checkmark (✅)**: Event passes all validation rules
* **Yellow warning (⚠️)**: Minor issues or missing optional data
* **Red error (❌)**: Critical validation failures
### Filter Options
Focus on specific issues:
* Filter by specific events (e.g., only "purchase" events)
* Show only e-commerce events
* Hide page\_view events for clarity
* Show only errors
* Show only warnings
* Show successful events
* Show unknown events
* Filter by URL pattern
* Focus on specific sections
* Exclude admin pages
* Last 5 minutes
* Last hour
* Custom time range
### Search Functionality
Powerful search across all event data:
```
Search examples:
- "transaction_id:ORD-12345" - Find specific order
- "value:>100" - Find high-value events
- "error:missing_variable" - Find specific errors
- "user_id:null" - Find events with null user IDs
```
## Advanced Features
### Session Replay
Link events to specific user sessions:
Toggle from "All Events" to "Session View"
Select a specific session ID or user
See complete event sequence for that session
Spot where tracking breaks in user journey
### Compare Mode
Compare expected vs actual data:
```
Expected (from Tracking Plan) | Actual (from Live Data)
----------------------------------|----------------------------------
event: "purchase" | event: "purchase" ✅
transaction_id: string (required) | transaction_id: "ORD-789" ✅
value: number (required) | value: "99.99" ❌ (string)
currency: string (required) | currency: "EUR" ✅
items: array (required) | items: [...] ✅
coupon: string (optional) | [missing] ⚠️
```
### Export Capabilities
Export debugging sessions for analysis:
* **JSON Export**: Complete event data
* **CSV Export**: Simplified tabular format
* **Share Link**: Send session to teammates
* **Create Report**: Generate debugging report
## Use Cases
### During Development
Verify tracking for new features before release
Ensure third-party tools integrate correctly
### Production Monitoring
Debug reported tracking problems
Monitor tracking performance metrics
## Integration with Other Tools
### Chrome extension
The Live Debugger complements the Chrome extension:
* **Chrome Extension**: Local debugging, single user
* **Live Debugger**: All traffic, multiple users
* **Both**: Can be used simultaneously
### Audit Reports
Link from audit reports to live debugging:
1. Find issue in audit report
2. Click "Debug Live"
3. Opens Live Debugger filtered to that issue
4. See real-time occurrences
### Data layer Collector
Switch between tools seamlessly:
* **Live Debugger**: Real-time monitoring
* **Data Layer Collector**: Historical analysis
* **Use both**: Complete picture of tracking health
## Best practices
### Effective Debugging
Begin with all events to understand context
Apply filters to focus on specific issues
Look for commonalities in failures
Make changes and verify in real-time
### Performance Tips
For high-traffic sites:
* **Use Sampling**: Enable sampling mode for performance
* **Apply Filters Early**: Reduce data volume
* **Focus Sessions**: Debug specific users/sessions
* **Clear Old Data**: Regularly clear debugging cache
## Common Debugging Scenarios
### Scenario 1: Missing Purchase Events
```
Filter: event:"purchase" OR page:"/confirmation"
Finding: Page loads without purchase events
Solution: Check conditional logic in tracking code
```
### Scenario 2: Malformed Data
```
Filter: status:"error" AND validation:"type_mismatch"
Finding: Prices sent as strings
Solution: Fix data type conversion
```
### Scenario 3: Timing Issues
```
View: Session replay mode
Finding: Events fire before data is ready
Solution: Implement proper event sequencing
```
## Keyboard Shortcuts
Speed up debugging with shortcuts:
| Shortcut | Action |
| -------- | ------------------- |
| `Space` | Pause/Resume stream |
| `C` | Clear event list |
| `F` | Focus filter box |
| `E` | Export current view |
| `S` | Toggle session mode |
| `Esc` | Close detail panel |
## Troubleshooting
* Verify pixel is installed and active
* Check browser ad blockers
* Confirm project selection
* Try refreshing the debugger
* Check network connection
* Enable sampling mode
* Clear debugging cache
* Contact support if persistent
* Ensure tracking plan is configured
* Check event names match exactly
* Verify validation rules are set
* Refresh tracking plan cache
## Next steps
Use for local debugging
Analyze historical data
Advanced debugging techniques
Configure automated monitoring