> ## Documentation Index
> Fetch the complete documentation index at: https://docs.taginsight.com/llms.txt
> Use this file to discover all available pages before exploring further.
# Chrome extension
> Capture, debug, and import tracking data with the Tag Insight Chrome Extension
## Overview
The Tag Insight Chrome Extension is a powerful tool that helps you capture, inspect, and debug tracking implementations directly from your browser. It's an essential companion for anyone working with Tag Insight.
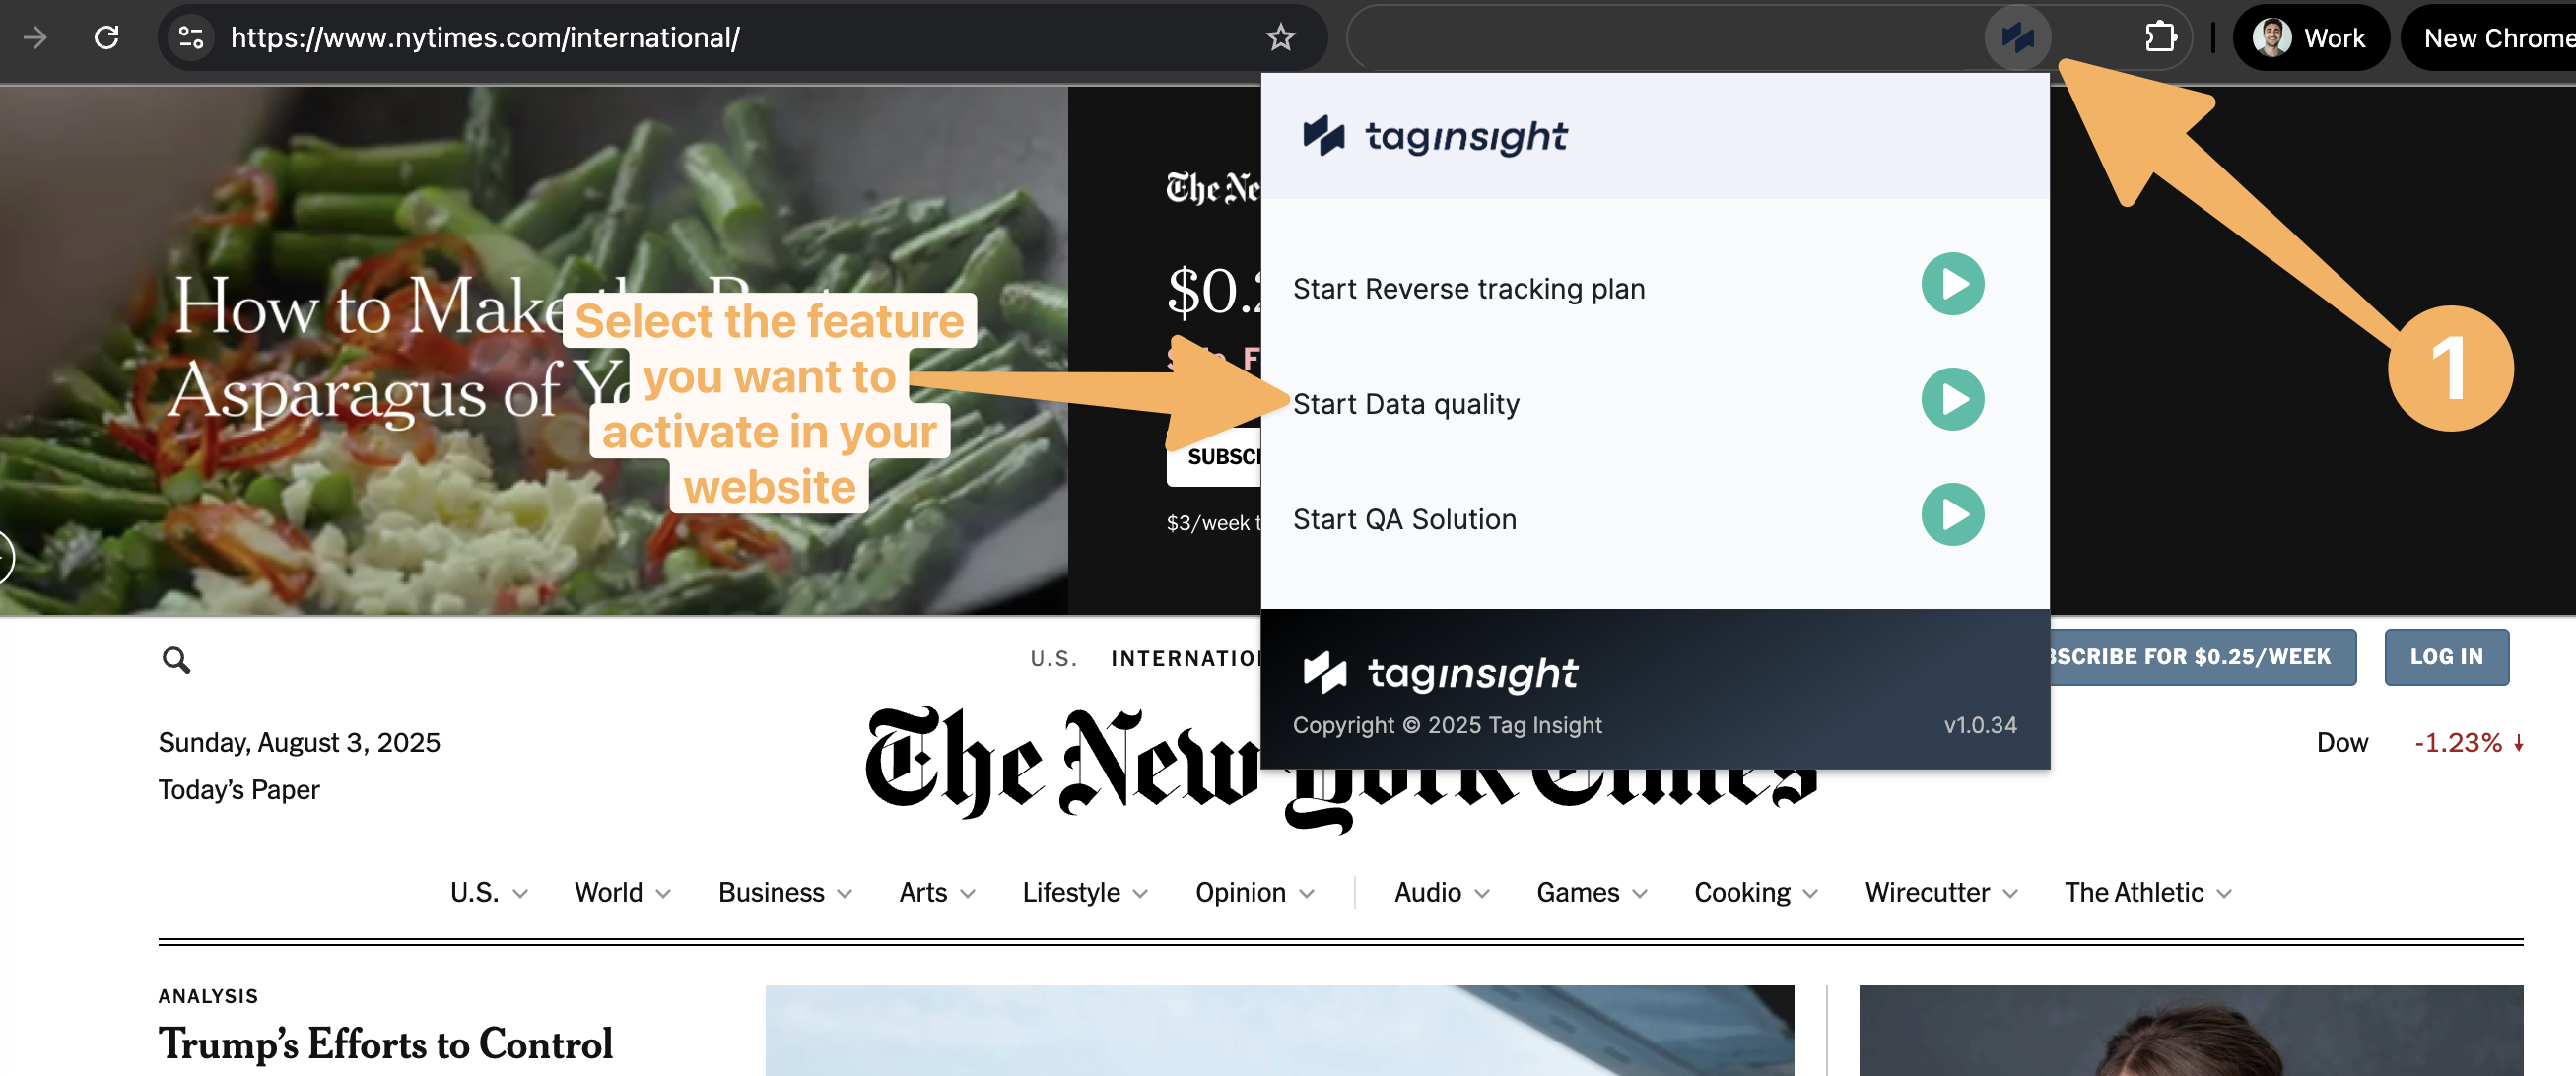 ## Installation
Search for "Tag Insight" in the Chrome Web Store or use the direct link from your dashboard
Click **Add to Chrome** and confirm the installation
Click the puzzle icon in Chrome and pin Tag Insight for easy access
Click the extension icon and log in with your Tag Insight credentials
## Features Overview
Real-time data layer inspection and debugging
Capture events as you browse for import
Verify Tag Insight pixel installation
Export captured data for analysis
## Live Debugging
The extension's live debugger shows all tracking events in real-time.
## Installation
Search for "Tag Insight" in the Chrome Web Store or use the direct link from your dashboard
Click **Add to Chrome** and confirm the installation
Click the puzzle icon in Chrome and pin Tag Insight for easy access
Click the extension icon and log in with your Tag Insight credentials
## Features Overview
Real-time data layer inspection and debugging
Capture events as you browse for import
Verify Tag Insight pixel installation
Export captured data for analysis
## Live Debugging
The extension's live debugger shows all tracking events in real-time.
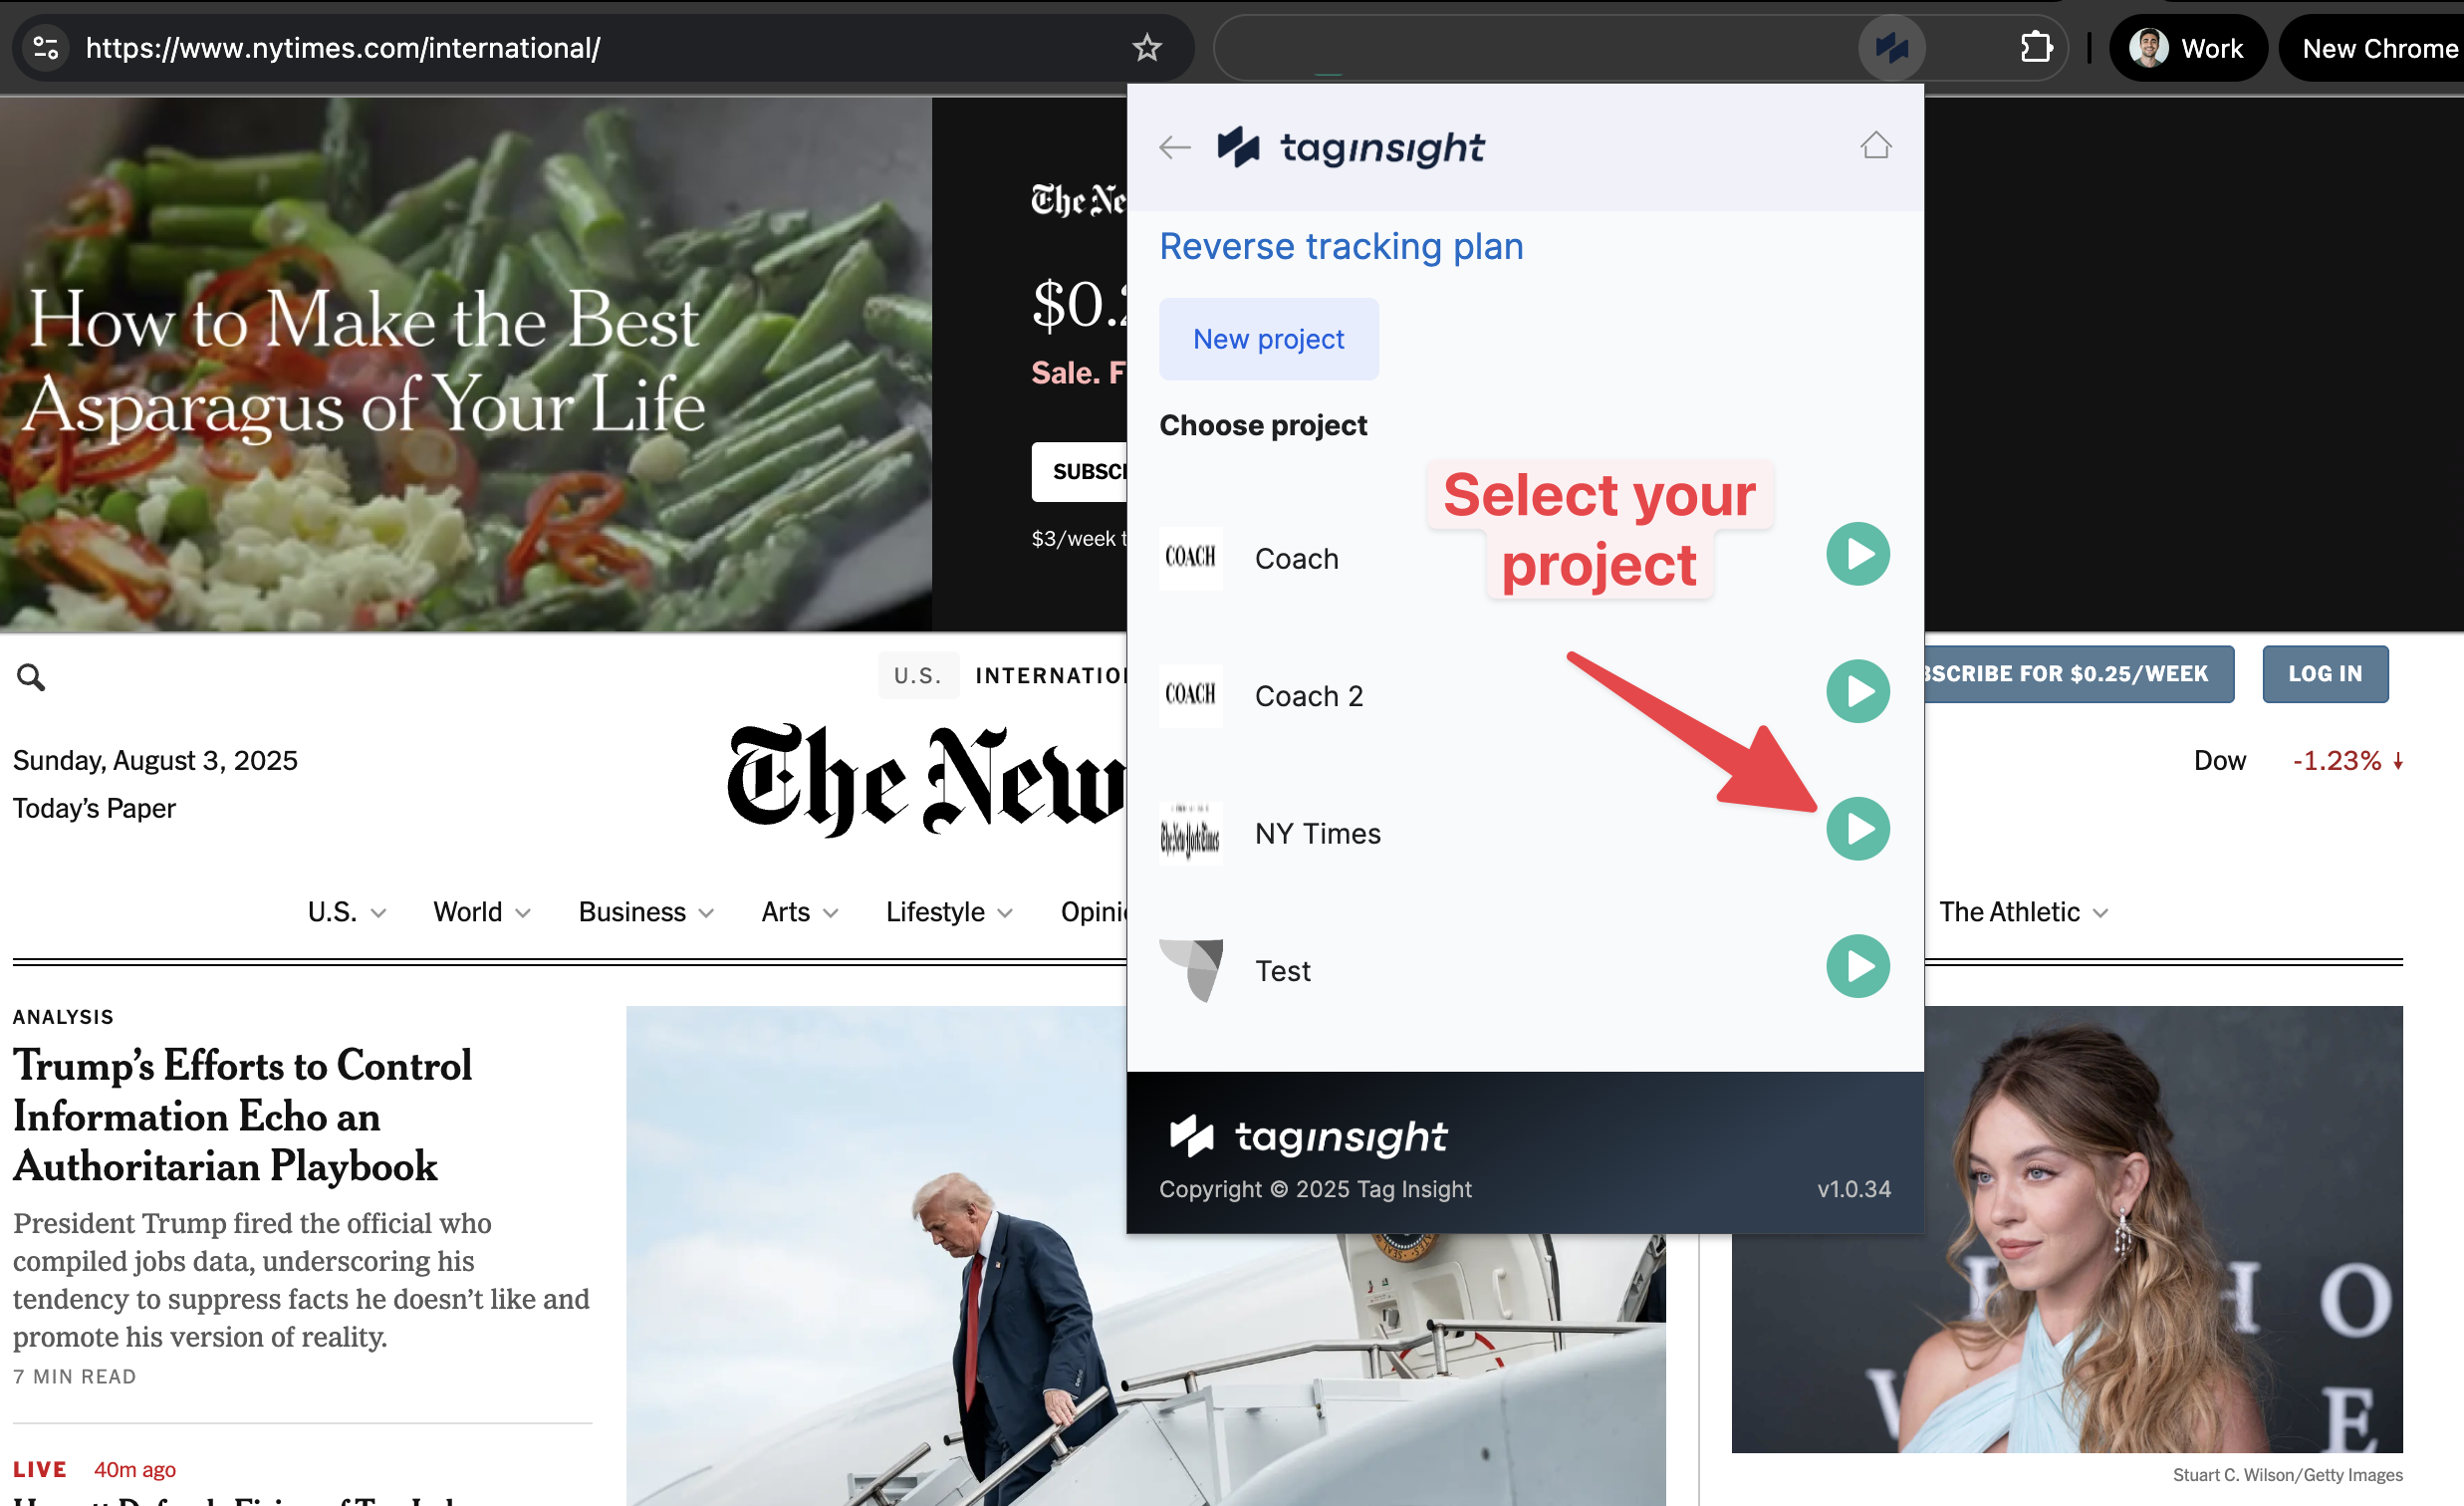 ### Debugger Interface
View all events as they fire:
* Event name and timestamp
* Variable count
* Page URL
* Event status (valid/invalid)
Click any event to see:
* Complete data layer
* Variable values
* Validation status
* Expected vs actual format
Filter events by:
* Event name
* Page URL
* Time range
* Validation status
### Debug Information
For each event, the extension shows:
```javascript theme={null}
{
// Event Information
event: "product_view",
timestamp: "2024-01-15T10:30:45.123Z",
page_url: "/products/blue-shirt",
// Validation Status
validation: {
status: "warning",
issues: [
"Missing required variable: product_category",
"Invalid format for price (expected number, got string)"
]
},
// Data Layer
dataLayer: {
event: "product_view",
product_id: "SKU123",
product_name: "Blue Shirt",
price: "29.99" // Should be 29.99 (number)
// Missing: product_category
}
}
```
## Reverse Tracking Plan
Use the extension to capture your existing implementation and create a tracking plan.
### Debugger Interface
View all events as they fire:
* Event name and timestamp
* Variable count
* Page URL
* Event status (valid/invalid)
Click any event to see:
* Complete data layer
* Variable values
* Validation status
* Expected vs actual format
Filter events by:
* Event name
* Page URL
* Time range
* Validation status
### Debug Information
For each event, the extension shows:
```javascript theme={null}
{
// Event Information
event: "product_view",
timestamp: "2024-01-15T10:30:45.123Z",
page_url: "/products/blue-shirt",
// Validation Status
validation: {
status: "warning",
issues: [
"Missing required variable: product_category",
"Invalid format for price (expected number, got string)"
]
},
// Data Layer
dataLayer: {
event: "product_view",
product_id: "SKU123",
product_name: "Blue Shirt",
price: "29.99" // Should be 29.99 (number)
// Missing: product_category
}
}
```
## Reverse Tracking Plan
Use the extension to capture your existing implementation and create a tracking plan.
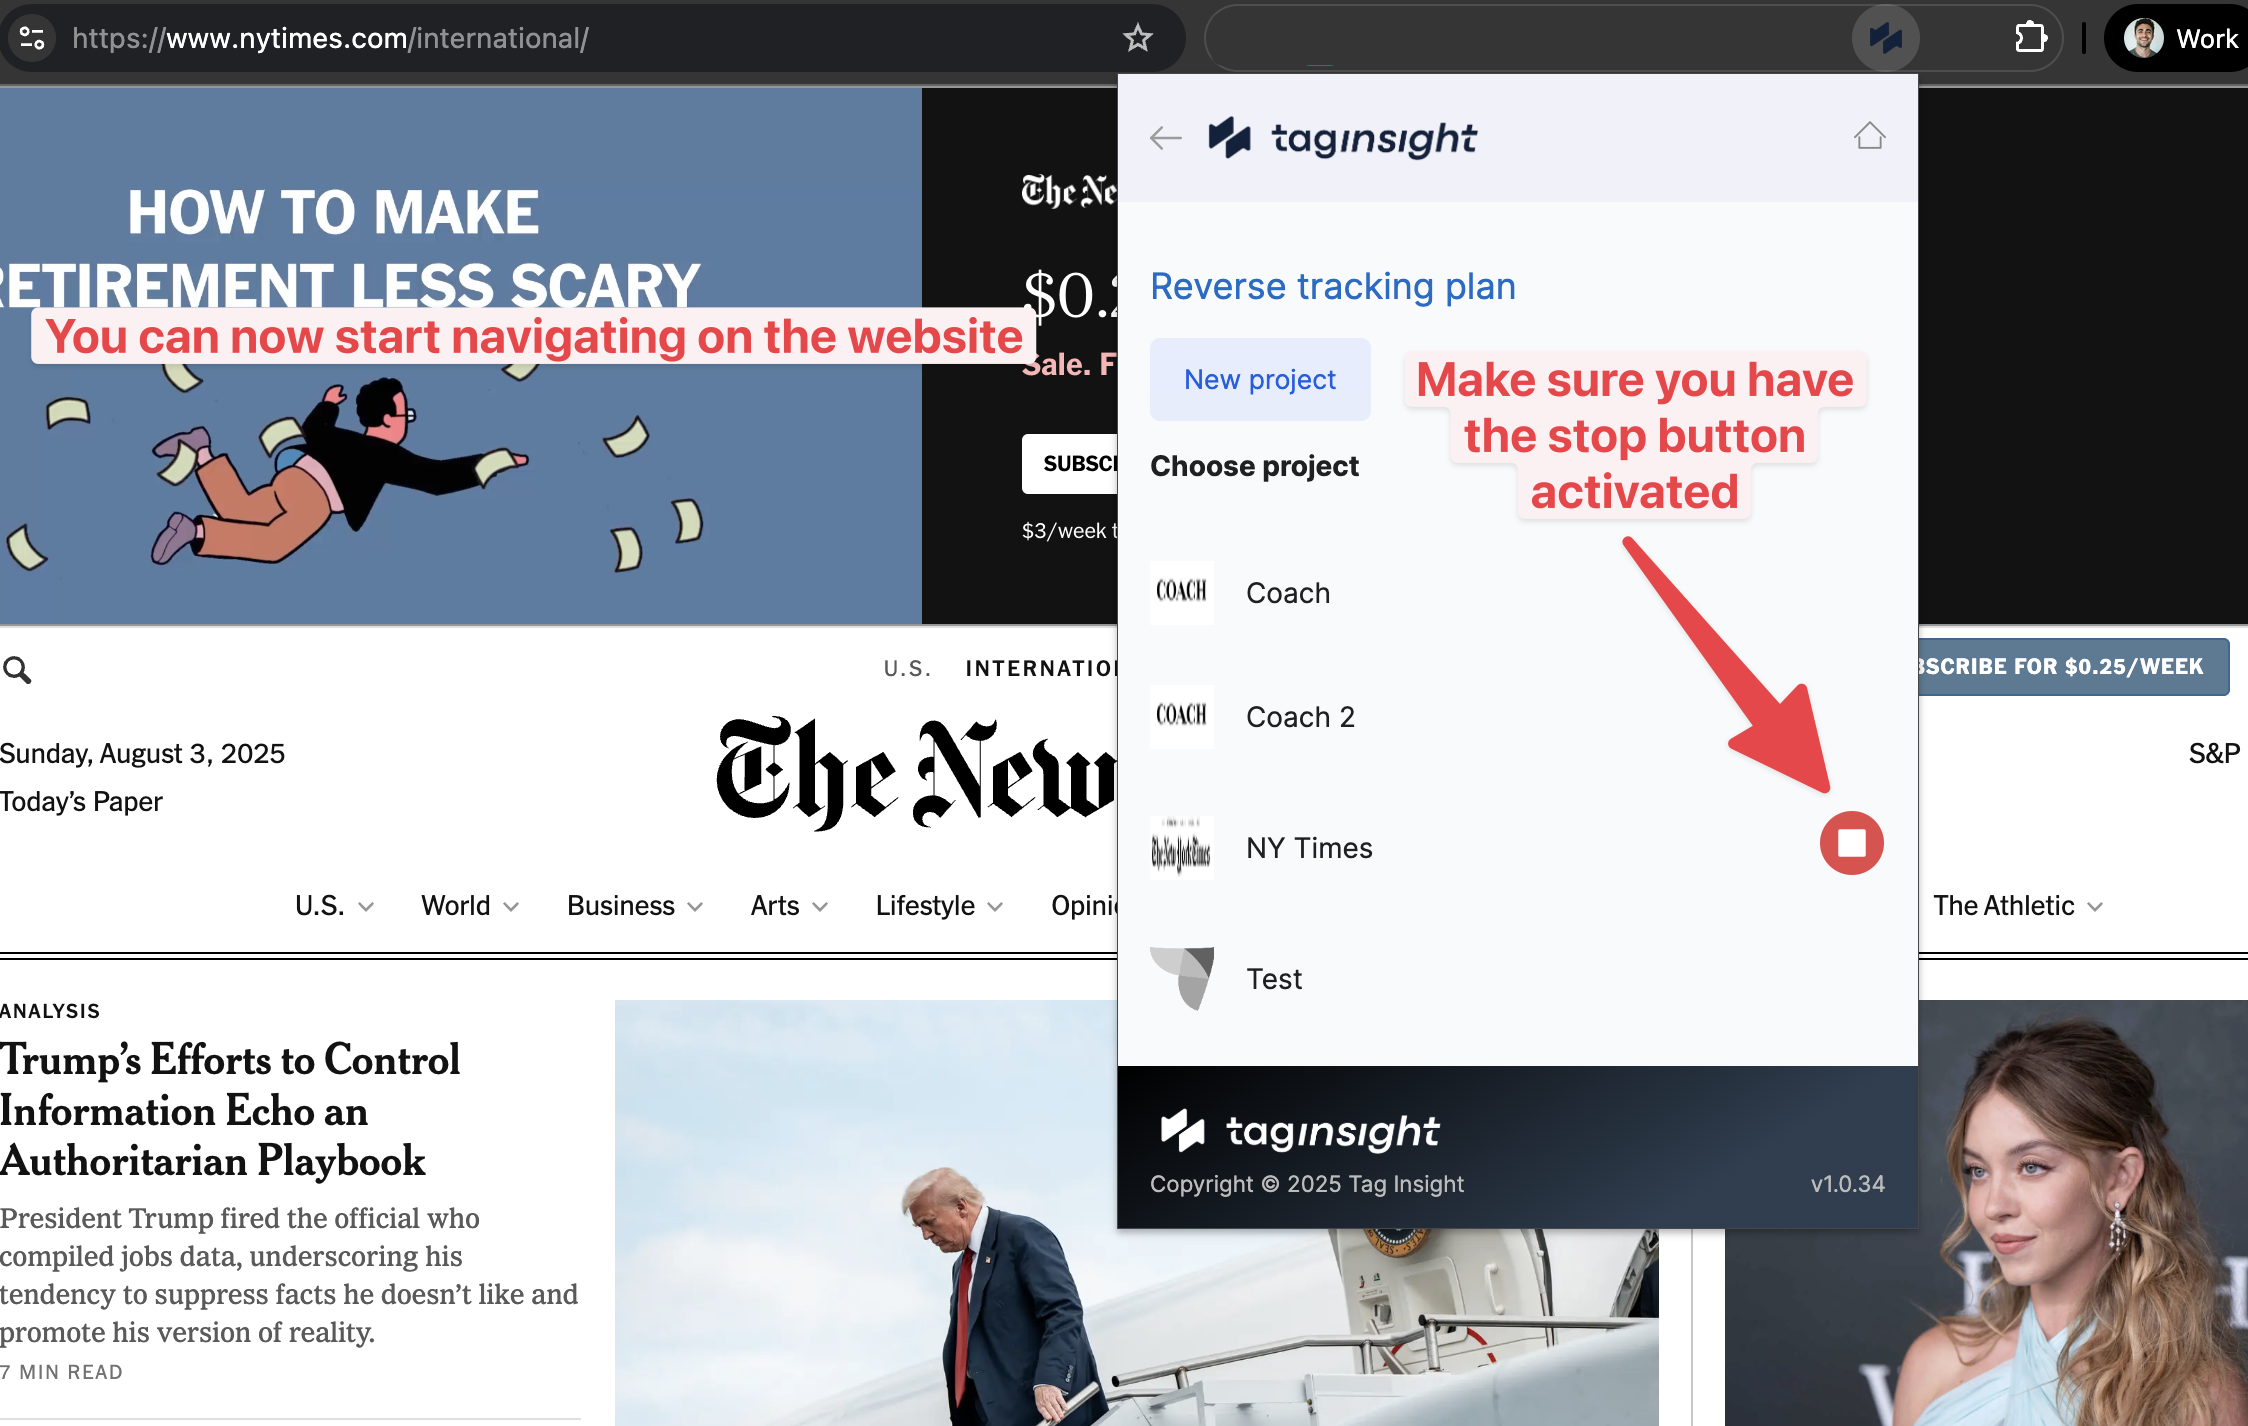 ### Capture Process
Click **Start Capture** in the extension
Navigate through key user journeys:
* Product browsing
* Add to cart
* Checkout flow
* Account actions
See all unique events captured with:
* Event frequency
* Variable variations
* Sample values
Choose which events to include in your tracking plan
Send selected events directly to your Tag Insight project
### Capture Settings
Configure capture behavior:
* **Capture Duration**: Set time limit or manual stop
* **Event Deduplication**: Merge similar events
* **Variable Sampling**: Number of samples to keep
* **Page Filtering**: Include/exclude URLs
## Pixel Verification
The extension automatically detects Tag Insight pixel installation.
### Pixel Status Indicators
* Pixel detected and working
* Shows project name
* Displays configuration
* Real-time event count
* Pixel detected but issues found
* Configuration mismatch
* Network errors
* Version outdated
* No pixel detected
* Installation instructions
* Quick setup guide
* Troubleshooting tips
### Pixel Information
When a pixel is detected, view:
```javascript theme={null}
{
status: "active",
project: "Main Site - Production",
project_id: "proj_123abc",
version: "1.2.3",
configuration: {
dataLayerName: "dataLayer",
environment: "production",
sampling: "100%"
},
events_captured: 47,
last_event: "2024-01-15T10:31:00Z"
}
```
## Quality Assurance Features
### Validation Testing
Test your tracking against the tracking plan:
Select active tracking plan from dropdown
Toggle **Live Validation** mode
Navigate and trigger events
See real-time validation results
### Validation Indicators
* 🟢 **Valid**: Event matches tracking plan perfectly
* 🟡 **Warning**: Minor issues (optional variables missing)
* 🔴 **Error**: Critical issues (required variables missing, wrong types)
* ⚪ **Unknown**: Event not in tracking plan
## Advanced Features
### Custom Data Layers
Configure the extension for custom implementations:
```javascript theme={null}
// Extension settings
{
dataLayers: [
"dataLayer", // Google Analytics
"digitalData", // Adobe
"customLayer" // Your custom layer
],
eventKey: "event", // Or "eventName", "action", etc.
debugMode: true
}
```
### Export Capabilities
Export captured data in multiple formats:
* **JSON**: Complete data structure
* **CSV**: Flattened for spreadsheets
* **Tag Insight Format**: Direct import ready
* **Documentation**: Markdown format
### Network Monitoring
Monitor tracking requests:
* GA4 measurement protocol calls
* Third-party pixels
* Server-side calls
* Performance metrics
## Use Cases
### Development Workflow
Review existing tracking with capture mode
Validate new tracking in real-time
Verify all events fire correctly
Identify and fix tracking issues
### QA process
1. **Load Test Plan**: Import test scenarios
2. **Execute Tests**: Follow test scripts
3. **Capture Results**: Document all events
4. **Compare**: Match against expected results
5. **Report**: Export findings
### Troubleshooting
Common debugging scenarios:
* Check event triggers
* Verify data layer pushes
* Look for JavaScript errors
* Test in incognito mode
* Inspect data sources
* Check transformations
* Verify timing issues
* Review data types
* Check for multiple triggers
* Review GTM/TMS setup
* Look for race conditions
* Verify page lifecycle
## Keyboard Shortcuts
Boost productivity with shortcuts:
| Shortcut | Action |
| -------------- | -------------------- |
| `Ctrl/Cmd + K` | Quick search events |
| `Ctrl/Cmd + E` | Export current view |
| `Ctrl/Cmd + R` | Refresh capture |
| `Ctrl/Cmd + F` | Filter events |
| `Space` | Pause/Resume capture |
| `Esc` | Close detail view |
## Settings and Preferences
### Extension Options
Configure the extension behavior:
* **Auto-Connect**: Connect to last project automatically
* **Notification**: Show alerts for validation errors
* **Storage**: Local event history duration
* **Performance**: Sampling for high-traffic sites
### Privacy Settings
* **Data Storage**: Events stored locally only
* **Auto-Clear**: Clear data on browser close
* **Sensitive Data**: Auto-mask PII fields
* **Incognito**: Disable in private browsing
## Integration with Tag Insight
### Seamless Workflow
The extension integrates directly with your Tag Insight projects:
1. **Project Selection**: Choose active project from dropdown
2. **Live Sync**: Changes reflected immediately
3. **Import Events**: Send captured events to tracking plan
4. **Validation Rules**: Use project's validation settings
### Collaborative Features
* Share capture sessions with team
* Export findings for review
* Comment on specific events
* Create tickets from issues
## Tips and Tricks
### Power User Tips
Select multiple events with Shift+Click for bulk actions
Use `/` to quickly filter events by name
Compare two events side-by-side with Ctrl+Click
Generate documentation from captured events
### Performance Optimization
For high-traffic sites:
1. Enable sampling mode
2. Filter by specific events
3. Limit capture duration
4. Use page filters
5. Clear old data regularly
## Troubleshooting
* Check Chrome version (88+ required)
* Verify permissions granted
* Try reinstalling extension
* Clear extension storage
* Verify login credentials
* Check network connection
* Confirm project access
* Try logging out and back in
* Check capture is started
* Verify data layer name
* Look for content security policy blocks
* Test in regular (not incognito) mode
## Next steps
Learn about importing captured events
Explore the web-based debugger
Set up validation for captured events
Optimize your tracking setup
### Capture Process
Click **Start Capture** in the extension
Navigate through key user journeys:
* Product browsing
* Add to cart
* Checkout flow
* Account actions
See all unique events captured with:
* Event frequency
* Variable variations
* Sample values
Choose which events to include in your tracking plan
Send selected events directly to your Tag Insight project
### Capture Settings
Configure capture behavior:
* **Capture Duration**: Set time limit or manual stop
* **Event Deduplication**: Merge similar events
* **Variable Sampling**: Number of samples to keep
* **Page Filtering**: Include/exclude URLs
## Pixel Verification
The extension automatically detects Tag Insight pixel installation.
### Pixel Status Indicators
* Pixel detected and working
* Shows project name
* Displays configuration
* Real-time event count
* Pixel detected but issues found
* Configuration mismatch
* Network errors
* Version outdated
* No pixel detected
* Installation instructions
* Quick setup guide
* Troubleshooting tips
### Pixel Information
When a pixel is detected, view:
```javascript theme={null}
{
status: "active",
project: "Main Site - Production",
project_id: "proj_123abc",
version: "1.2.3",
configuration: {
dataLayerName: "dataLayer",
environment: "production",
sampling: "100%"
},
events_captured: 47,
last_event: "2024-01-15T10:31:00Z"
}
```
## Quality Assurance Features
### Validation Testing
Test your tracking against the tracking plan:
Select active tracking plan from dropdown
Toggle **Live Validation** mode
Navigate and trigger events
See real-time validation results
### Validation Indicators
* 🟢 **Valid**: Event matches tracking plan perfectly
* 🟡 **Warning**: Minor issues (optional variables missing)
* 🔴 **Error**: Critical issues (required variables missing, wrong types)
* ⚪ **Unknown**: Event not in tracking plan
## Advanced Features
### Custom Data Layers
Configure the extension for custom implementations:
```javascript theme={null}
// Extension settings
{
dataLayers: [
"dataLayer", // Google Analytics
"digitalData", // Adobe
"customLayer" // Your custom layer
],
eventKey: "event", // Or "eventName", "action", etc.
debugMode: true
}
```
### Export Capabilities
Export captured data in multiple formats:
* **JSON**: Complete data structure
* **CSV**: Flattened for spreadsheets
* **Tag Insight Format**: Direct import ready
* **Documentation**: Markdown format
### Network Monitoring
Monitor tracking requests:
* GA4 measurement protocol calls
* Third-party pixels
* Server-side calls
* Performance metrics
## Use Cases
### Development Workflow
Review existing tracking with capture mode
Validate new tracking in real-time
Verify all events fire correctly
Identify and fix tracking issues
### QA process
1. **Load Test Plan**: Import test scenarios
2. **Execute Tests**: Follow test scripts
3. **Capture Results**: Document all events
4. **Compare**: Match against expected results
5. **Report**: Export findings
### Troubleshooting
Common debugging scenarios:
* Check event triggers
* Verify data layer pushes
* Look for JavaScript errors
* Test in incognito mode
* Inspect data sources
* Check transformations
* Verify timing issues
* Review data types
* Check for multiple triggers
* Review GTM/TMS setup
* Look for race conditions
* Verify page lifecycle
## Keyboard Shortcuts
Boost productivity with shortcuts:
| Shortcut | Action |
| -------------- | -------------------- |
| `Ctrl/Cmd + K` | Quick search events |
| `Ctrl/Cmd + E` | Export current view |
| `Ctrl/Cmd + R` | Refresh capture |
| `Ctrl/Cmd + F` | Filter events |
| `Space` | Pause/Resume capture |
| `Esc` | Close detail view |
## Settings and Preferences
### Extension Options
Configure the extension behavior:
* **Auto-Connect**: Connect to last project automatically
* **Notification**: Show alerts for validation errors
* **Storage**: Local event history duration
* **Performance**: Sampling for high-traffic sites
### Privacy Settings
* **Data Storage**: Events stored locally only
* **Auto-Clear**: Clear data on browser close
* **Sensitive Data**: Auto-mask PII fields
* **Incognito**: Disable in private browsing
## Integration with Tag Insight
### Seamless Workflow
The extension integrates directly with your Tag Insight projects:
1. **Project Selection**: Choose active project from dropdown
2. **Live Sync**: Changes reflected immediately
3. **Import Events**: Send captured events to tracking plan
4. **Validation Rules**: Use project's validation settings
### Collaborative Features
* Share capture sessions with team
* Export findings for review
* Comment on specific events
* Create tickets from issues
## Tips and Tricks
### Power User Tips
Select multiple events with Shift+Click for bulk actions
Use `/` to quickly filter events by name
Compare two events side-by-side with Ctrl+Click
Generate documentation from captured events
### Performance Optimization
For high-traffic sites:
1. Enable sampling mode
2. Filter by specific events
3. Limit capture duration
4. Use page filters
5. Clear old data regularly
## Troubleshooting
* Check Chrome version (88+ required)
* Verify permissions granted
* Try reinstalling extension
* Clear extension storage
* Verify login credentials
* Check network connection
* Confirm project access
* Try logging out and back in
* Check capture is started
* Verify data layer name
* Look for content security policy blocks
* Test in regular (not incognito) mode
## Next steps
Learn about importing captured events
Explore the web-based debugger
Set up validation for captured events
Optimize your tracking setup