> ## Documentation Index
> Fetch the complete documentation index at: https://docs.taginsight.com/llms.txt
> Use this file to discover all available pages before exploring further.
# Dashboard overview
> Navigate and understand the Tag Insight dashboard
## Overview
The Tag Insight dashboard is your command center for tracking quality management. It provides at-a-glance insights into your tracking health, recent issues, and ongoing audits across all your projects.
## Dashboard layout
Based on the Tag Insight menu structure, your dashboard includes:
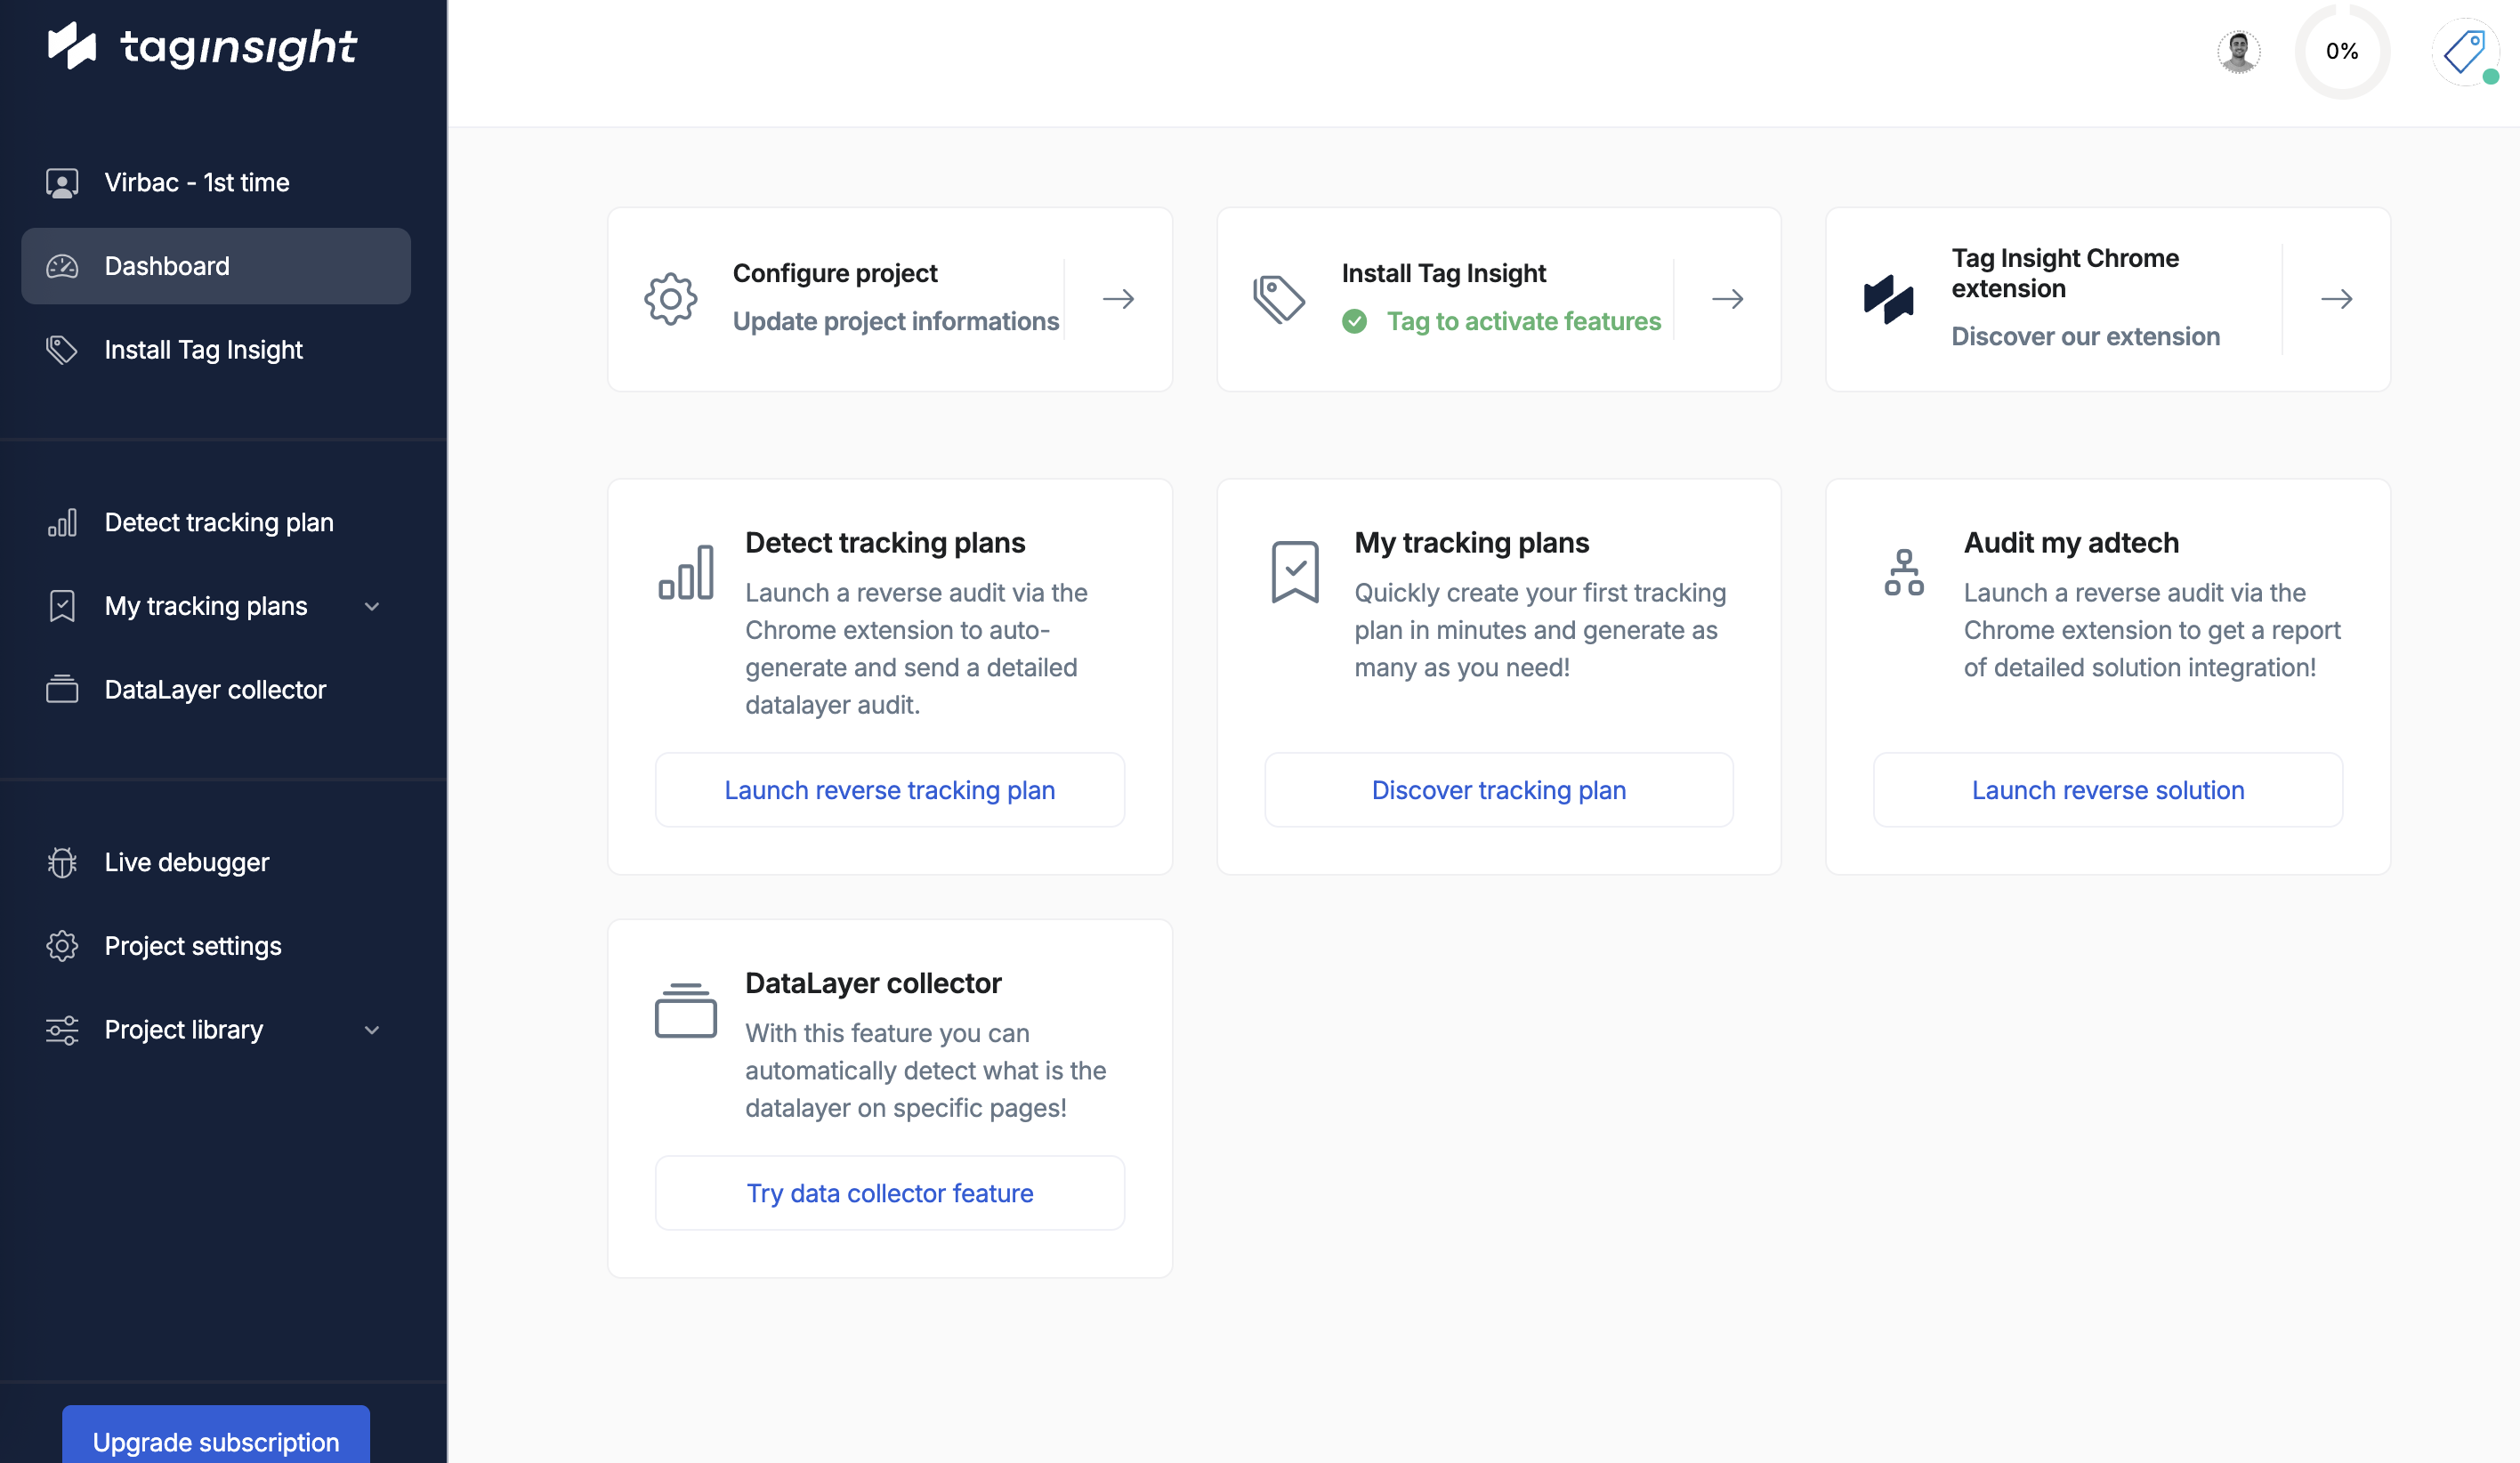 ### Main navigation
* **Dashboard**: Overview and metrics
* **Install Tag Insight**: Pixel installation guide
* **Detect tracking plan**: Automatic discovery
* **My tracking plans**: Plan management
* **Audit my adtech**: Monitoring configuration
* **DataLayer collector**: Historical data logging
* **Live debugger**: Real-time debugging
* **Project settings**: Configuration options
* **Events**: Event definitions
* **Event Types**: Event categorization
* **Event Page Types**: Page classifications
* **Event Trigger Types**: Trigger definitions
* **Custom Attributes**: Custom properties
* **Page Perimeters**: URL patterns
* **Solutions**: Analytics tools
* **Parameters**: Variable definitions
* **Function Templates**: Reusable functions
* **Triggers**: Event triggers
## Dashboard components
### Tracking health score
The main metric showing overall tracking quality:
```
┌─────────────────────────────────────────┐
│ Tracking Health │
│ │
│ 94.2% │
│ ████████████████░░ │
│ │
│ ↓ -2.3% from last week │
└─────────────────────────────────────────┘
```
**Score Calculation**:
* Based on successful validations vs total events
* Weighted by event importance
* Updated in real-time or after each audit
### Recent issues panel
Quick view of the latest tracking problems:
**Critical (2)**
* Missing "purchase" event on /checkout/confirm - 2 hours ago
* Transaction ID format invalid - 3 hours ago
**Warnings (5)**
* Optional "coupon" field missing - 4 hours ago
* Price format inconsistency - 6 hours ago
* New untracked event detected - 1 day ago
\[View All Issues →]
### Audit status
Monitor your active audits:
```
Active Audits
─────────────────────────────────────────
✅ Daily production check | Completed 2h ago
🔄 Continuous monitoring | Running
⏱️ Weekly deep scan | Scheduled in 3d
❌ Checkout flow audit | Failed - View logs
```
### Traffic overview
Real-time tracking activity:
**15.2K**
↑ 12% from average
**3,421**
Currently on site
**0.8%**
↓ Improving
## Key metrics
### Tracking coverage
Visual representation of tracking completeness:
```
Event Coverage by Category
──────────────────────────
E-commerce ████████████████████ 100%
User Actions ███████████████████░ 95%
Navigation ████████████████████ 100%
Engagement ████████████░░░░░░░░ 65%
Custom Events ██████████████░░░░░░ 72%
```
### Trend analysis
Historical tracking quality:
```
Last 30 Days Tracking Health
────────────────────────────
100% ┤ ╭─╮
95% ┤ ╭───╯ ╰─╮
90% ┤╭╯ ╰──╮
85% ┤╯ ╰─╮
80% ┼──────────────╯
└─────────────────────────→
1w 2w 3w Today
```
### Top issues
Most frequent tracking problems:
| Issue | Occurrences | Trend |
| ----------------------- | ----------- | ----- |
| Missing transaction\_id | 145 | ↑ 23% |
| Price type mismatch | 89 | ↓ 12% |
| Empty product\_category | 67 | → 0% |
| Invalid date format | 45 | ↑ 5% |
## Quick actions
Access frequently used features:
Trigger an immediate audit of your tracking
Access the most recent audit report
Open the live debugger
Download tracking quality reports
## Project selector
Switch between projects easily:
```
Current Project: Main Site - Production
────────────────────────────────────────
Other Projects:
• Main Site - Staging | 98.5% ✅
• Mobile App - iOS | 92.1% ⚠️
• Mobile App - Android | 94.7% ✅
• Marketing Site | 99.2% ✅
```
## Notifications center
Stay informed about tracking health:
* 🔴 Critical: Purchase tracking failed (2h ago)
* 🟡 Warning: High error rate detected (5h ago)
* 🔵 Info: New tracking plan version available
* Audit "Daily Check" completed successfully
* 15 new events detected and catalogued
* Chrome extension updated to v2.1.0
* Sarah updated purchase event validation
* Mike created new tracking plan version
* System auto-fixed 3 validation rules
## Customization options
### Dashboard widgets
Customize your dashboard view:
1. Click **Customize Dashboard**
2. Add/remove widgets:
* Tracking Health Score
* Recent Issues
* Traffic Metrics
* Custom Reports
* Team Activity
3. Drag to rearrange
4. Save layout
### Saved views
Create custom dashboard configurations:
* **Executive View**: High-level metrics only
* **Developer View**: Technical details and errors
* **QA View**: Focus on validation and testing
* **Custom Views**: Create your own
## Integration points
### External dashboards
Embed Tag Insight metrics:
```javascript theme={null}
// Widget embed code
```
### Export options
Export dashboard data in multiple formats:
* PDF reports for stakeholders
* CSV data for analysis
* Markdown for documentation
## Performance indicators
### System status
Monitor Tag Insight service health:
* **Pixel Status**: ✅ Operational
* **Data Processing**: ✅ Real-time
* **Audit Engine**: ✅ Running
* **Export**: ✅ Available
### Resource usage
For enterprise accounts:
* **Events Processed**: 1.2M / 5M limit
* **Storage Used**: 34GB / 100GB
* **Audit Hours**: 168 / 500
* **Audit Runs**: 12,451 / 50,000
## Best practices
### Daily routine
Review overnight issues and tracking health
Prioritize critical issues for immediate action
Check if error rates are increasing
Ensure no new critical issues before close
### Dashboard hygiene
* **Clear resolved issues** to maintain clarity
* **Update saved views** as needs change
* **Archive old projects** to reduce clutter
* **Review widget relevance** monthly
## Mobile access
The Tag Insight dashboard is responsive:
* **Full functionality** on tablets
* **Read-only view** optimized for phones
* **Push notifications** for critical alerts
* **Offline mode** for cached data
## Keyboard navigation
Navigate efficiently with shortcuts:
| Shortcut | Action |
| -------- | ---------------- |
| `D` | Go to Dashboard |
| `P` | Project selector |
| `A` | Run audit |
| `L` | Live debugger |
| `R` | Refresh data |
| `?` | Show shortcuts |
## FAQ
Real-time metrics update every 30 seconds. Audit results update upon completion.
Yes, create read-only links or add team members with viewer permissions.
Yes, toggle in user preferences or use system setting detection.
Yes, export as PDF reports or CSV data.
## Next steps
Set up Tag Insight monitoring
Create your monitoring strategy
Add team members
Start real-time debugging
### Main navigation
* **Dashboard**: Overview and metrics
* **Install Tag Insight**: Pixel installation guide
* **Detect tracking plan**: Automatic discovery
* **My tracking plans**: Plan management
* **Audit my adtech**: Monitoring configuration
* **DataLayer collector**: Historical data logging
* **Live debugger**: Real-time debugging
* **Project settings**: Configuration options
* **Events**: Event definitions
* **Event Types**: Event categorization
* **Event Page Types**: Page classifications
* **Event Trigger Types**: Trigger definitions
* **Custom Attributes**: Custom properties
* **Page Perimeters**: URL patterns
* **Solutions**: Analytics tools
* **Parameters**: Variable definitions
* **Function Templates**: Reusable functions
* **Triggers**: Event triggers
## Dashboard components
### Tracking health score
The main metric showing overall tracking quality:
```
┌─────────────────────────────────────────┐
│ Tracking Health │
│ │
│ 94.2% │
│ ████████████████░░ │
│ │
│ ↓ -2.3% from last week │
└─────────────────────────────────────────┘
```
**Score Calculation**:
* Based on successful validations vs total events
* Weighted by event importance
* Updated in real-time or after each audit
### Recent issues panel
Quick view of the latest tracking problems:
**Critical (2)**
* Missing "purchase" event on /checkout/confirm - 2 hours ago
* Transaction ID format invalid - 3 hours ago
**Warnings (5)**
* Optional "coupon" field missing - 4 hours ago
* Price format inconsistency - 6 hours ago
* New untracked event detected - 1 day ago
\[View All Issues →]
### Audit status
Monitor your active audits:
```
Active Audits
─────────────────────────────────────────
✅ Daily production check | Completed 2h ago
🔄 Continuous monitoring | Running
⏱️ Weekly deep scan | Scheduled in 3d
❌ Checkout flow audit | Failed - View logs
```
### Traffic overview
Real-time tracking activity:
**15.2K**
↑ 12% from average
**3,421**
Currently on site
**0.8%**
↓ Improving
## Key metrics
### Tracking coverage
Visual representation of tracking completeness:
```
Event Coverage by Category
──────────────────────────
E-commerce ████████████████████ 100%
User Actions ███████████████████░ 95%
Navigation ████████████████████ 100%
Engagement ████████████░░░░░░░░ 65%
Custom Events ██████████████░░░░░░ 72%
```
### Trend analysis
Historical tracking quality:
```
Last 30 Days Tracking Health
────────────────────────────
100% ┤ ╭─╮
95% ┤ ╭───╯ ╰─╮
90% ┤╭╯ ╰──╮
85% ┤╯ ╰─╮
80% ┼──────────────╯
└─────────────────────────→
1w 2w 3w Today
```
### Top issues
Most frequent tracking problems:
| Issue | Occurrences | Trend |
| ----------------------- | ----------- | ----- |
| Missing transaction\_id | 145 | ↑ 23% |
| Price type mismatch | 89 | ↓ 12% |
| Empty product\_category | 67 | → 0% |
| Invalid date format | 45 | ↑ 5% |
## Quick actions
Access frequently used features:
Trigger an immediate audit of your tracking
Access the most recent audit report
Open the live debugger
Download tracking quality reports
## Project selector
Switch between projects easily:
```
Current Project: Main Site - Production
────────────────────────────────────────
Other Projects:
• Main Site - Staging | 98.5% ✅
• Mobile App - iOS | 92.1% ⚠️
• Mobile App - Android | 94.7% ✅
• Marketing Site | 99.2% ✅
```
## Notifications center
Stay informed about tracking health:
* 🔴 Critical: Purchase tracking failed (2h ago)
* 🟡 Warning: High error rate detected (5h ago)
* 🔵 Info: New tracking plan version available
* Audit "Daily Check" completed successfully
* 15 new events detected and catalogued
* Chrome extension updated to v2.1.0
* Sarah updated purchase event validation
* Mike created new tracking plan version
* System auto-fixed 3 validation rules
## Customization options
### Dashboard widgets
Customize your dashboard view:
1. Click **Customize Dashboard**
2. Add/remove widgets:
* Tracking Health Score
* Recent Issues
* Traffic Metrics
* Custom Reports
* Team Activity
3. Drag to rearrange
4. Save layout
### Saved views
Create custom dashboard configurations:
* **Executive View**: High-level metrics only
* **Developer View**: Technical details and errors
* **QA View**: Focus on validation and testing
* **Custom Views**: Create your own
## Integration points
### External dashboards
Embed Tag Insight metrics:
```javascript theme={null}
// Widget embed code
```
### Export options
Export dashboard data in multiple formats:
* PDF reports for stakeholders
* CSV data for analysis
* Markdown for documentation
## Performance indicators
### System status
Monitor Tag Insight service health:
* **Pixel Status**: ✅ Operational
* **Data Processing**: ✅ Real-time
* **Audit Engine**: ✅ Running
* **Export**: ✅ Available
### Resource usage
For enterprise accounts:
* **Events Processed**: 1.2M / 5M limit
* **Storage Used**: 34GB / 100GB
* **Audit Hours**: 168 / 500
* **Audit Runs**: 12,451 / 50,000
## Best practices
### Daily routine
Review overnight issues and tracking health
Prioritize critical issues for immediate action
Check if error rates are increasing
Ensure no new critical issues before close
### Dashboard hygiene
* **Clear resolved issues** to maintain clarity
* **Update saved views** as needs change
* **Archive old projects** to reduce clutter
* **Review widget relevance** monthly
## Mobile access
The Tag Insight dashboard is responsive:
* **Full functionality** on tablets
* **Read-only view** optimized for phones
* **Push notifications** for critical alerts
* **Offline mode** for cached data
## Keyboard navigation
Navigate efficiently with shortcuts:
| Shortcut | Action |
| -------- | ---------------- |
| `D` | Go to Dashboard |
| `P` | Project selector |
| `A` | Run audit |
| `L` | Live debugger |
| `R` | Refresh data |
| `?` | Show shortcuts |
## FAQ
Real-time metrics update every 30 seconds. Audit results update upon completion.
Yes, create read-only links or add team members with viewer permissions.
Yes, toggle in user preferences or use system setting detection.
Yes, export as PDF reports or CSV data.
## Next steps
Set up Tag Insight monitoring
Create your monitoring strategy
Add team members
Start real-time debugging