> ## Documentation Index
> Fetch the complete documentation index at: https://docs.taginsight.com/llms.txt
> Use this file to discover all available pages before exploring further.
# Data layer collector
> Capture and analyze tracking data from your most important pages
## Overview
The Data Layer Collector is like a recording device for your website tracking. It captures all the tracking data from specific pages so you can see exactly what information is being collected from real visitors.
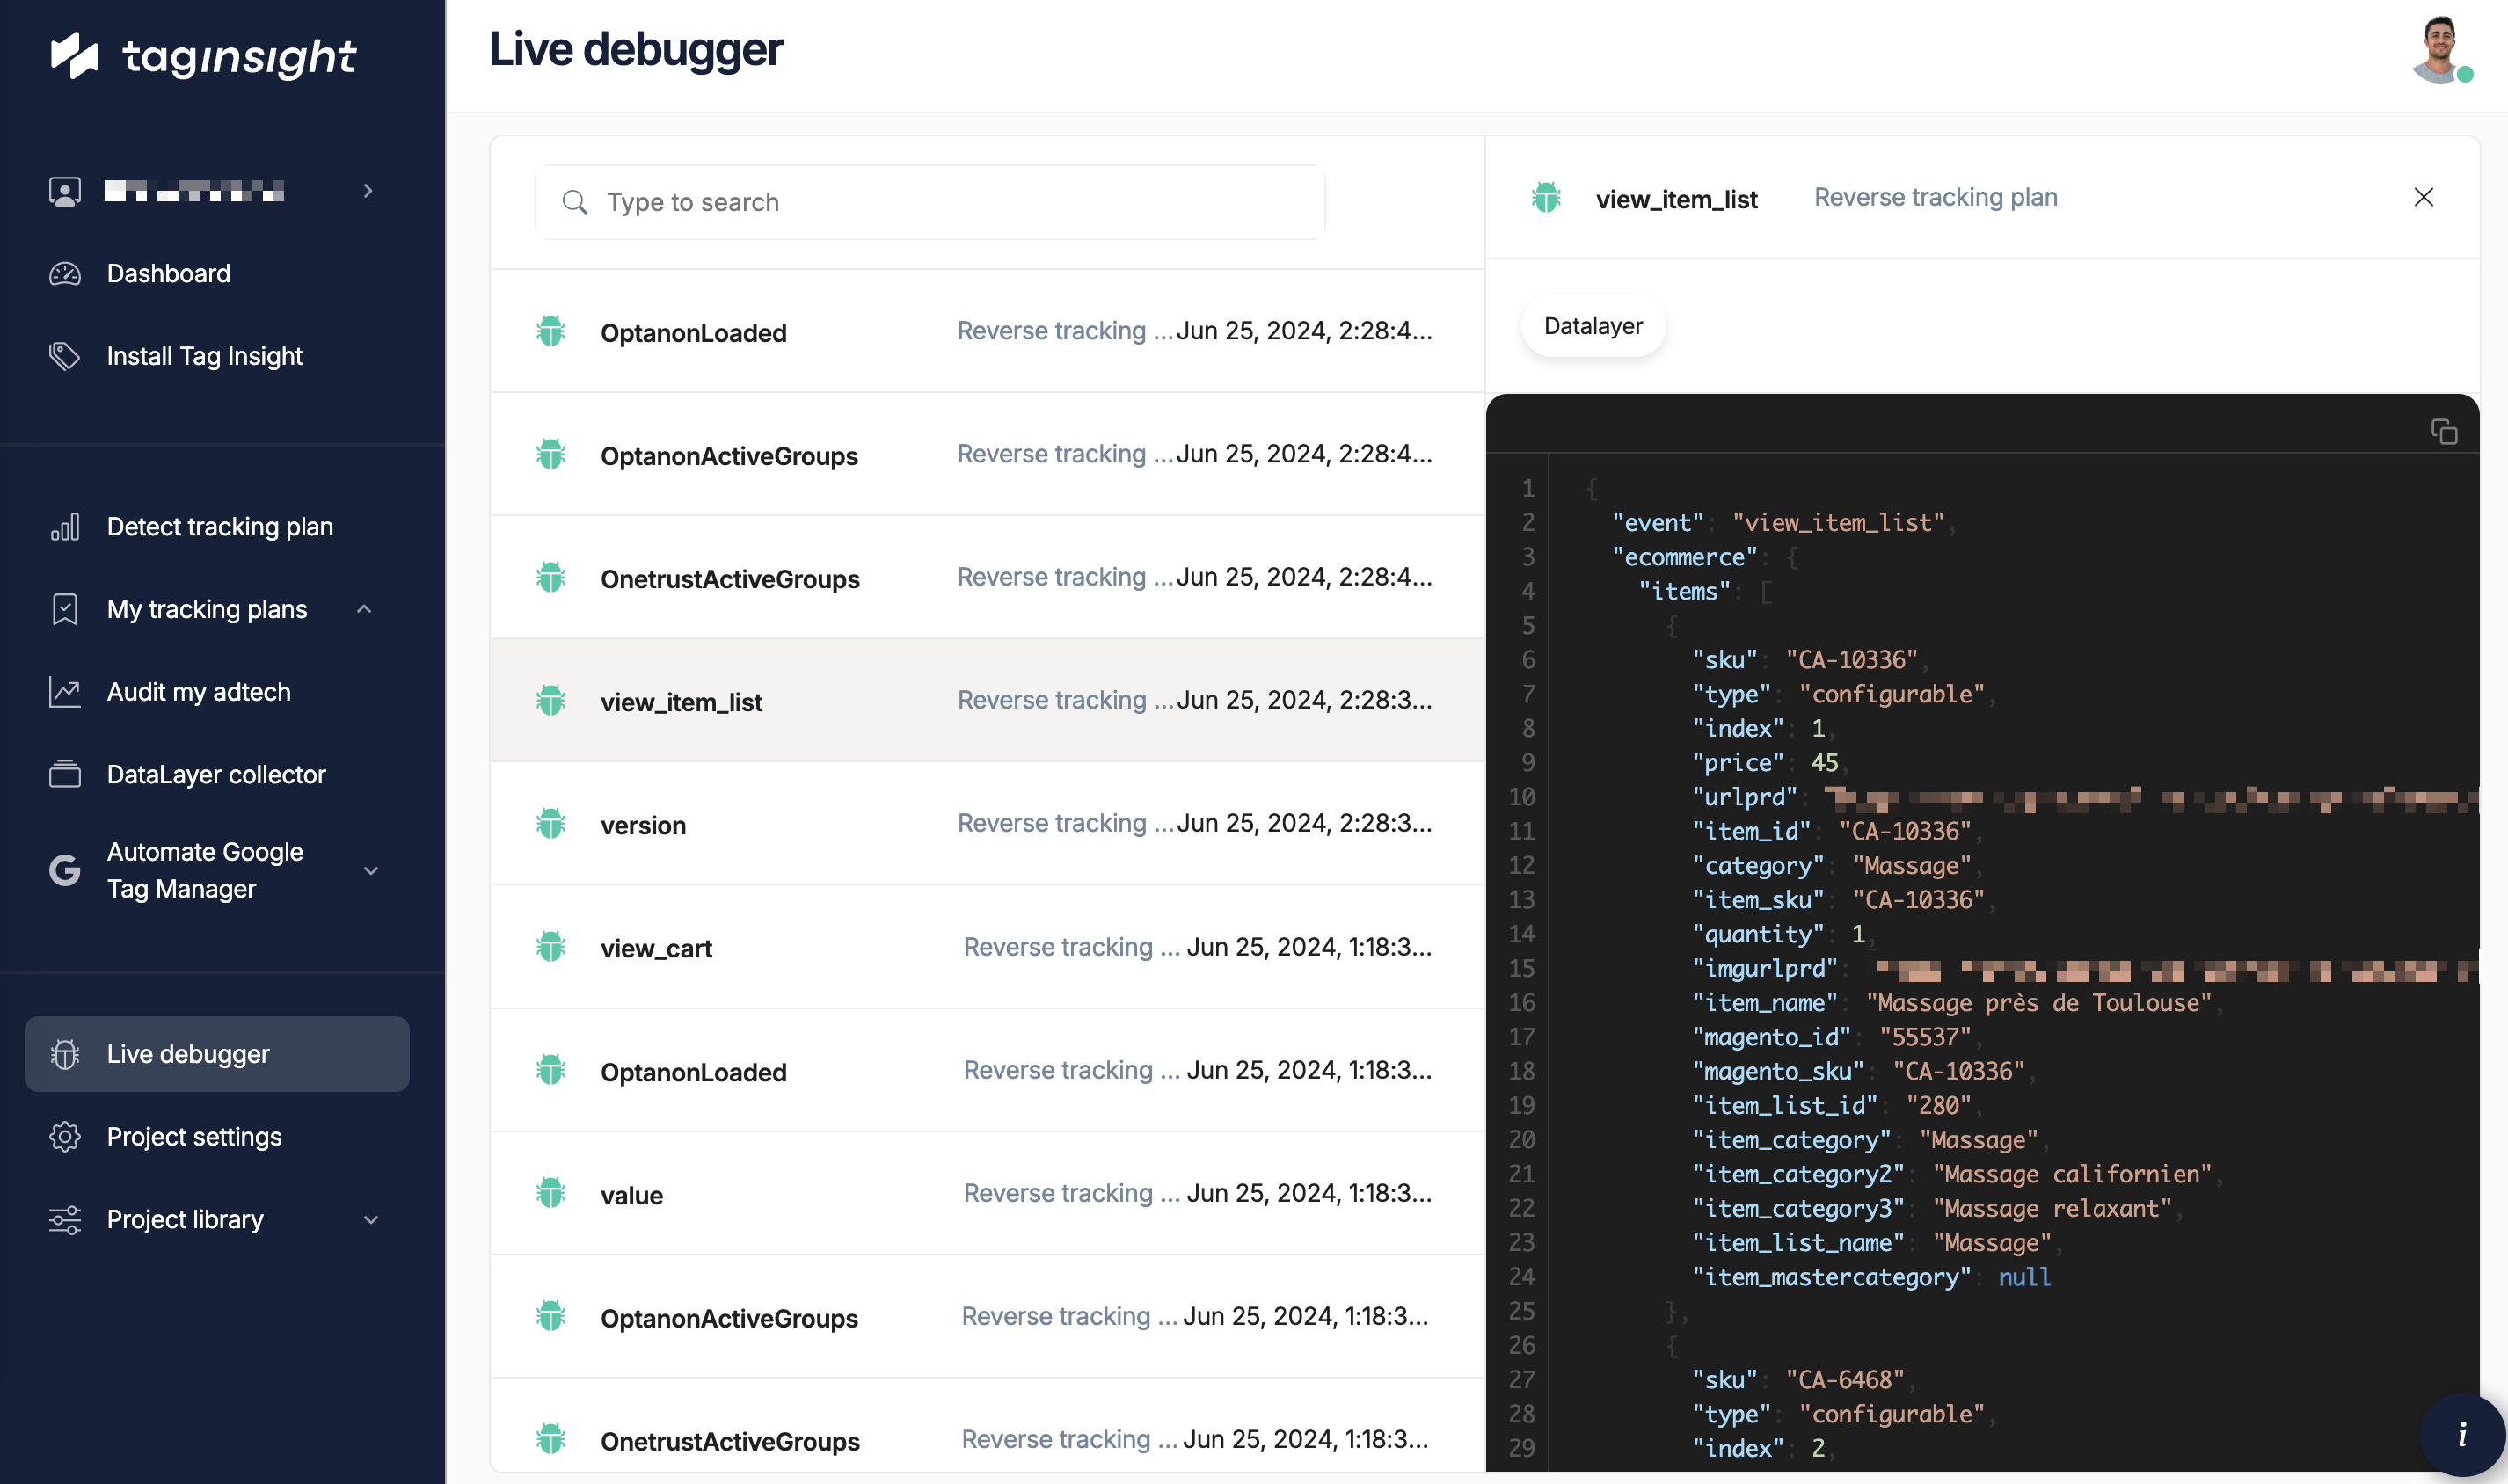 This feature is especially useful for understanding purchase data without having to make test purchases yourself.
## Why use the data collector?
Analyze real purchases without making test transactions
See exactly what data is being sent
Learn from real customer behavior
## How it works
Think of it as a security camera for your tracking:
1. You tell it which pages to watch
2. It records all tracking activity on those pages
3. You can review the recordings later
4. Find and fix any problems you spot
## Setting up collection
### Quick start
In Tag Insight, navigate to **Monitoring > Data Layer Collector**
Click **+ New Collection** button
* **Name**: Give it a clear name like "Checkout Page Monitor"
* **Pages**: Which pages to monitor (like order confirmation)
* **Duration**: How long to collect (usually 24 hours)
* **Limit**: Maximum events to store (like 1000)
Turn it on and let it gather real data
### What to monitor
Focus on your most important pages:
* **Order confirmation pages** - See what purchase data looks like
* **Sign-up forms** - Check registration information
* **Key conversion pages** - Verify important actions
* **Error pages** - Understand what went wrong
## Common uses
### Understanding purchases
Instead of making test purchases, see real ones:
* Order details (ID, total, items)
* Customer information (type, location)
* Payment methods used
* Any errors or issues
* No need for test credit cards
* See real customer variations
* Spot missing information
* Verify calculations are correct
* Missing order IDs
* Wrong currency formats
* Incomplete product details
* Payment method variations
### Debugging forms
See what happens when people submit forms:
* Which fields are filled out
* What causes errors
* How long submissions take
* Success vs failure rates
### Finding patterns
Discover trends in your data:
* Most common purchase amounts
* Popular product combinations
* Peak activity times
* Unusual behaviors
## Analyzing collected data
### Viewing your data
Once collected, you can:
* **Search**: Find specific values or events
* **Filter**: Focus on certain time periods
* **Sort**: Organize by different criteria
* **Export**: Download for deeper analysis
### What to look for
Check if important data is absent:
* Order IDs on purchase pages
* Product details in cart events
* User IDs for logged-in customers
Spot formatting issues:
* Prices with currency symbols
* Dates in different formats
* IDs that don't match patterns
Find outliers:
* Extremely high or low prices
* Unusual product combinations
* Error messages you didn't expect
## Best practices
### Smart collection
Focus on pages that matter most:
* Where money changes hands
* Where customers convert
* Where problems often occur
* **Time**: 24-48 hours usually enough
* **Events**: Based on your traffic
* **Storage**: Don't collect more than needed
* Check collected data weekly
* Look for new issues
* Update what you monitor
* Don't collect sensitive data
* Use anonymization features
* Follow privacy laws
### Collection tips
**For high-traffic sites:**
* Collect a sample (like 10% of visitors)
* Shorter time periods
* Focus on specific issues
**For important but rare events:**
* Collect everything
* Longer time periods
* Set up alerts
## Industry examples
### E-commerce
Monitor checkout pages to understand:
* What customers actually buy
* Payment preferences
* Cart abandonment reasons
* Discount code usage
### Media sites
Track content engagement:
* Which articles get read
* Video completion rates
* Subscription conversions
* Share patterns
### B2B websites
Analyze lead generation:
* Form completion rates
* Information quality
* Source tracking
* Demo requests
## Privacy and security
### Automatic protection
Tag Insight automatically protects sensitive data:
* Email addresses are partially hidden
* Credit card numbers are masked
* Personal details are anonymized
* IP addresses are truncated
### Your responsibilities
* Only collect what you need
* Follow your privacy policy
* Delete data when done
* Limit access to authorized users
## Troubleshooting
Check:
* Is Tag Insight installed on those pages?
* Are the page URLs correct?
* Is the collection still active?
* Are people visiting those pages?
Try:
* Collecting a smaller sample
* Focusing on specific pages
* Shorter collection periods
* Filtering specific events only
Verify:
* The data exists on the page
* It's being tracked correctly
* No conditions preventing capture
* Different scenarios and users
## Using your findings
### Create action items
When you find issues:
1. Document what's wrong
2. Show examples from real data
3. Explain the business impact
4. Share with your tech team
### Verify fixes
After changes are made:
1. Set up new collection
2. Monitor the same pages
3. Confirm issues are resolved
4. Document the improvement
### Share insights
Use collected data to:
* Show stakeholders real examples
* Justify tracking improvements
* Train team members
* Build better processes
## Export and reporting
### Export options
Best for:
* Creating reports
* Sharing with non-technical teams
* Building charts
* Further analysis
Good for:
* Technical team debugging
* Detailed investigation
* System integration
* Archive purposes
### What to include in reports
* Summary of findings
* Specific examples
* Business impact
* Recommended fixes
* Timeline for resolution
## Working with your team
### For marketing
* Identify what data you need
* Explain why it matters
* Review findings together
* Prioritize fixes
### For developers
* Share specific examples
* Provide clear reproduction steps
* Test fixes together
* Confirm resolution
## Next steps
Configure automatic tracking checks
Understand your tracking health
Get notified of issues
See tracking in real-time
This feature is especially useful for understanding purchase data without having to make test purchases yourself.
## Why use the data collector?
Analyze real purchases without making test transactions
See exactly what data is being sent
Learn from real customer behavior
## How it works
Think of it as a security camera for your tracking:
1. You tell it which pages to watch
2. It records all tracking activity on those pages
3. You can review the recordings later
4. Find and fix any problems you spot
## Setting up collection
### Quick start
In Tag Insight, navigate to **Monitoring > Data Layer Collector**
Click **+ New Collection** button
* **Name**: Give it a clear name like "Checkout Page Monitor"
* **Pages**: Which pages to monitor (like order confirmation)
* **Duration**: How long to collect (usually 24 hours)
* **Limit**: Maximum events to store (like 1000)
Turn it on and let it gather real data
### What to monitor
Focus on your most important pages:
* **Order confirmation pages** - See what purchase data looks like
* **Sign-up forms** - Check registration information
* **Key conversion pages** - Verify important actions
* **Error pages** - Understand what went wrong
## Common uses
### Understanding purchases
Instead of making test purchases, see real ones:
* Order details (ID, total, items)
* Customer information (type, location)
* Payment methods used
* Any errors or issues
* No need for test credit cards
* See real customer variations
* Spot missing information
* Verify calculations are correct
* Missing order IDs
* Wrong currency formats
* Incomplete product details
* Payment method variations
### Debugging forms
See what happens when people submit forms:
* Which fields are filled out
* What causes errors
* How long submissions take
* Success vs failure rates
### Finding patterns
Discover trends in your data:
* Most common purchase amounts
* Popular product combinations
* Peak activity times
* Unusual behaviors
## Analyzing collected data
### Viewing your data
Once collected, you can:
* **Search**: Find specific values or events
* **Filter**: Focus on certain time periods
* **Sort**: Organize by different criteria
* **Export**: Download for deeper analysis
### What to look for
Check if important data is absent:
* Order IDs on purchase pages
* Product details in cart events
* User IDs for logged-in customers
Spot formatting issues:
* Prices with currency symbols
* Dates in different formats
* IDs that don't match patterns
Find outliers:
* Extremely high or low prices
* Unusual product combinations
* Error messages you didn't expect
## Best practices
### Smart collection
Focus on pages that matter most:
* Where money changes hands
* Where customers convert
* Where problems often occur
* **Time**: 24-48 hours usually enough
* **Events**: Based on your traffic
* **Storage**: Don't collect more than needed
* Check collected data weekly
* Look for new issues
* Update what you monitor
* Don't collect sensitive data
* Use anonymization features
* Follow privacy laws
### Collection tips
**For high-traffic sites:**
* Collect a sample (like 10% of visitors)
* Shorter time periods
* Focus on specific issues
**For important but rare events:**
* Collect everything
* Longer time periods
* Set up alerts
## Industry examples
### E-commerce
Monitor checkout pages to understand:
* What customers actually buy
* Payment preferences
* Cart abandonment reasons
* Discount code usage
### Media sites
Track content engagement:
* Which articles get read
* Video completion rates
* Subscription conversions
* Share patterns
### B2B websites
Analyze lead generation:
* Form completion rates
* Information quality
* Source tracking
* Demo requests
## Privacy and security
### Automatic protection
Tag Insight automatically protects sensitive data:
* Email addresses are partially hidden
* Credit card numbers are masked
* Personal details are anonymized
* IP addresses are truncated
### Your responsibilities
* Only collect what you need
* Follow your privacy policy
* Delete data when done
* Limit access to authorized users
## Troubleshooting
Check:
* Is Tag Insight installed on those pages?
* Are the page URLs correct?
* Is the collection still active?
* Are people visiting those pages?
Try:
* Collecting a smaller sample
* Focusing on specific pages
* Shorter collection periods
* Filtering specific events only
Verify:
* The data exists on the page
* It's being tracked correctly
* No conditions preventing capture
* Different scenarios and users
## Using your findings
### Create action items
When you find issues:
1. Document what's wrong
2. Show examples from real data
3. Explain the business impact
4. Share with your tech team
### Verify fixes
After changes are made:
1. Set up new collection
2. Monitor the same pages
3. Confirm issues are resolved
4. Document the improvement
### Share insights
Use collected data to:
* Show stakeholders real examples
* Justify tracking improvements
* Train team members
* Build better processes
## Export and reporting
### Export options
Best for:
* Creating reports
* Sharing with non-technical teams
* Building charts
* Further analysis
Good for:
* Technical team debugging
* Detailed investigation
* System integration
* Archive purposes
### What to include in reports
* Summary of findings
* Specific examples
* Business impact
* Recommended fixes
* Timeline for resolution
## Working with your team
### For marketing
* Identify what data you need
* Explain why it matters
* Review findings together
* Prioritize fixes
### For developers
* Share specific examples
* Provide clear reproduction steps
* Test fixes together
* Confirm resolution
## Next steps
Configure automatic tracking checks
Understand your tracking health
Get notified of issues
See tracking in real-time